Analyzing the technical and/or fundamental characteristics of an individual security is obviously a requirement before investing. However, very few traders go the extra mile and evaluate the characteristics of the market sector as well. Using sector confirmation can help you identify trades with the highest probability of success, which should significantly increase your percentage of winning trades.
Normally, sector analysis means evaluating the recent price performance of the sector. However, in this case it means assessing the commitment of traders (COT) data at the sector level. COT data is one of the most valuable trading resources that I have found. If you would like a refresher on analyzing COT data, please revisit my earlier article "Trade With the Experts." Below you will find an explanation of how to use COT data at the sector level to confirm your individual futures trades.
COT Analysis
Legacy COT data aggregates futures positions for commercial traders, large speculators, and small speculators. When using COT data, our objective is to trade with the commercial traders and against the speculators, but only at historically extreme position levels. In addition, commercial traders are typically early, so we need to wait for confirmation of the reversal in the price trend before entering a new directional trade.
To make it easier to evaluate COT data across all futures contracts, I created a standardized indicator that combines the relative positions of commercials and speculators into a single value. The resulting COT indicator value is not expressed in terms of the number of futures contracts. Instead, it represents a standardized deviation from the normal positions for commercials and speculators for each futures contract. That means that we can also calculate the average COT indicator value for each futures sector, not just for each individual futures contract. This allows us to evaluate the positions of commercials and speculators for the entire sector and to use that information for trade confirmation.
Futures Sectors
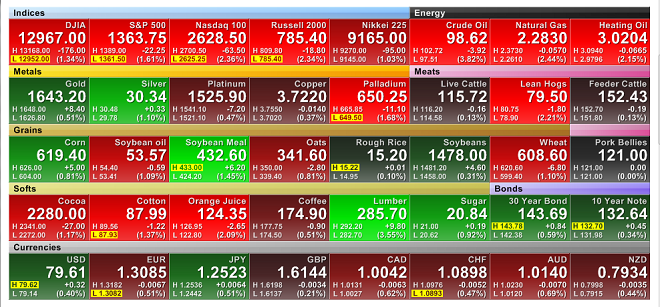
Figure 1 below is a color heat-map of the performance of a wide range of futures contracts on May 4th, 2012 . The image is a screen shot from FINVIZ.com, which stands for Financial Visualizations. FINVIZ is also one of our affiliates and you will find a separate link to FINVIZ products in the sidebar to the right.
The FINVIZ daily heat-map provides a comprehensive overview of the primary futures markets. Note how the individual futures contracts are grouped by sector; each sector has a color-coded title bar. The top row of the heat-map includes equity and energy contracts. The next row includes metals and meats. Grains are in the third row, followed by softs and bonds in the next. Finally, currencies take up the entire bottom row. I will use a different classification when calculating sector COT values, but the FINVIZ heat-map image below will give you a general overview of the contracts within each sector.
Some futures traders use all futures contracts, but many traders specialize in specific sectors, developing extensive knowledge in those sectors over many years of trading. When they want to initiate a position in metals, they evaluate the technical and fundamental characteristics of gold, silver, platinum, copper, and palladium and choose the contact with the best risk/return profile. In addition, traders will often trade one metals contract against another using a spread trade. As a result, to fully understand the positions of commercials and speculators in the metal sector, we need to calculate the average of the COT indicator values for all metals contracts.
I calculate average sector COT indicator values for the following futures sectors:
- Domestic Equity Indices
- United States Treasury Notes and Bonds (10-year US Note & 30-year US Bond)
- Energy (Crude Oil, Heating Oil, and Gasoline)
- Currency - Risk On (EUR, GBP, CAD, CHF, and AUD)
- Currency - Risk Off (USD & JPY)
- Metals (Gold, Silver, Platinum, Copper, and Palladium)
- Grains (Corn, Soybean Oil, Oats, Soybeans, & Wheat)
- Softs (Cocoa, Cotton, Orange Juice, Coffee, Lumber, & Sugar)
- Meats (Live Cattle, Lean Hogs, & Feeder Cattle)
You will notice some differences between my sector classifications and the FINVIZ heat-map. I excluded several contracts for liquidity reasons (e.g. rough rice). In addition, I excluded natural gas from the energy sector because its price behavior is completely unrelated to the oil and gasoline contracts.
I also split the currency contracts into risk-on and risk-off sectors. When traders desire more risk, they tend to shift from the USD and JPY into the EUR, GPB, CAD, CHF, and AUD contracts. The risk-on and risk-off classifications may need to change over time. For example, the Swiss Franc (CHF) contract used to be in the risk-off group until they pegged their currency to the Euro.
For these categories to be meaningful, the contract price within each sector should be positively correlated. While I calculate an average COT indicator value for Softs, the futures contracts in this group tend to be diverse, so I do not assign much weight to the COT indicator value for the Softs sector.
Sector COT Indicator
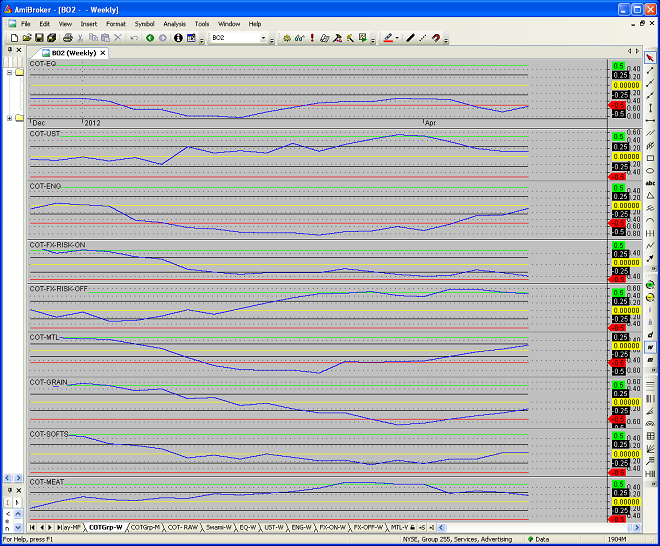
Figure 2 below is a weekly chart of the average COT indicator values for each of my futures sectors. It covers the period from December 2011 through May 5, 2012. There is one sector per chart pane. The blue line is the average COT indicator value for the sector. The yellow horizontal line is the neutral line. When the blue indicator line is above the green horizontal line, then the COT positions are extreme and a bullish trend should eventually emerge. When the blue indicator line is below the red horizontal line, then the COT positions are extreme and prices should begin to turn down. The COT indicator is almost always early. As a result, never establish a contra-trend position until prices begin to reverse.
I recognize that it is difficult to make out the detail on the chart, but if you look carefully you should be able to identify the relative COT values for each sector. At the far right side of the chart below (5/4/2012), you can see that the COT indicator for domestic equities is bearish (below the red line) and has been for several weeks. The indicator correctly anticipated the recent pull-back that we are seeing in the equity markets.
The bond COT indicator (second panel) is not currently at an extreme, but was above the green bullish threshold in late-March. Treasury futures prices have risen significantly in the last month, which again was consistent with the bullish COT sector signal in late-March.
The energy COT indicator (third panel) is no longer at an extreme, but was quite bearish throughout February and March, which coincided with the tops in the crude oil, heating oil, and gasoline markets. Prices in all three energy markets have declined significantly in the last month.
I will not take the time to go through every futures sector, but you get the idea. While the above examples would have all led to profitable trades, the sector COT indicator should not be used in isolation. It is not infallible, but it does offer a consistent directional interpretation of commercial and speculator positions in every futures sector. You could use it as an initial screening device, helping you identify the most bullish and bearish sectors. Once you have identified an extreme sector, you could analyze each of the contracts within that sector, looking for the best possible trade and the optimal entry point.
Putting it All Together
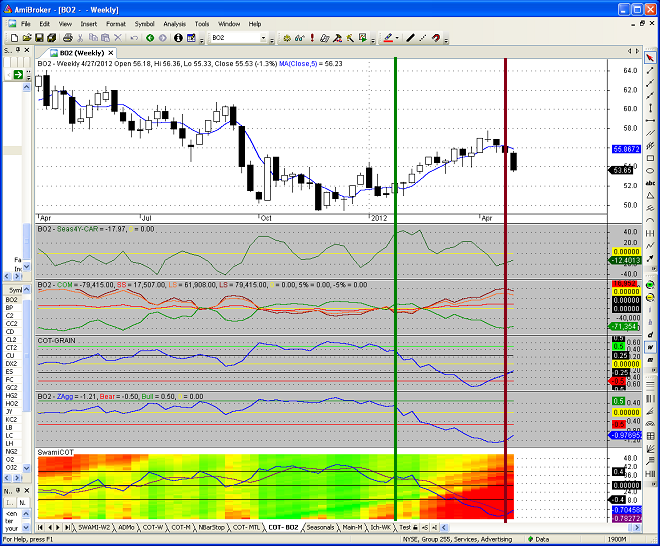
Figure 3 below is a weekly chart of the continuous soybean oil futures contract for the period from April 2011 through May 5, 2012. The top panel is a candlestick price chart with a 5-week moving average. The second panel is my custom seasonal indicator, which calculates the average historical compound annual return for a 1-month holding period. The third panel contains the raw COT data for commercials, large speculators, and small speculators.
The fourth panel is the average COT indicator for the grain sector, which we will use for trade confirmation. The fifth panel is the actual COT indicator for the soybean oil contract, calculated over a specific time period. Finally, the last panel is the enhanced SWAMI COT chart for the soybean oil contract, which illustrates the COT values for multiple look-back periods. If you are unfamiliar with SWAMI charts, please read my article, "Look at the Big Picture" for a more thorough explanation.
Let's look at a short soybean oil futures trade that I executed at the closing price on April 27th (the red vertical line in Figure 3 below). To find this trade, I initially sorted my list of individual futures contracts by COT indicator value, which is depicted in the fifth panel below. Out of all of the futures contracts, soybean oil had the worst (most negative) COT value, making it an excellent bearish or short candidate.
However, the COT indicator value for the soybean oil contract was only calculated for one specific period, so I confirmed that the COT indicator values in the SWAMI chart (bottom panel) were also extreme. As you can see, the average COT value over all look-back periods was far below the bottom extreme threshold and the entire chart was shaded red or bearish.
The average COT indicator value for the grain sector (fourth panel) was at a bearish extreme a few weeks earlier, which coincided with the top in the grain markets. While the COT indicator for the grain sector was no longer extreme at the time of the trade, that is not unusual. Again, we always wait for the price trend to begin to reverse before establishing a contra-trend position. When this happens, the COT values will typically begin to moderate as well.
Finally, I also confirmed the short soybean oil trade using my custom seasonal indicator. Historically, the seasonal compound annual return for soybeans oil was negative 18% for a one-month holding period, for trades entered in late April. Looking back at the seasonal indicator values for the past year, it is obvious that the seasonal trend is predominately negative until late-September. The poor seasonal tendencies for soybean oil clearly supported a short position.
The short entry signal was confirmed when the price of soybean oil futures closed below the weekly moving average on April 27th.
All of the following factors put the odds in favor of a short soybean oil position on April 27th:
- Individual COT indicator value for soybean oil was the most bearish (of all the futures contracts)
- Sector COT indicator for grains was recently below the bearish extreme threshold
- Seasonal trend for soybean oil was negative
- Price trend had reversed
Trade set-ups don't get any better. Soybean oil prices may continue to decline or they may reverse, stopping out this trade for a small gain or even a modest loss. There are no guarantees; but if we consistently use multiple confirmation tools to enter high-probability trades and use stops to limit our risk, we stack the deck in our favor and greatly improve our long-term chance of trading success.
Please note that this above trade is presented for educational purposes only and is not a trade recommendation. In addition, entering trades after the original signal can dramatically change the risk/return profile of the trade. Please read the Disclaimer & Terms page in its entirety.
If you would like additional practice interpreting the indicator values in the soybean oil chart, take a look at the bullish signal above (vertical green line). While the COT values had been extreme for a number of weeks prior to the signal, the green line signifies the first time that the bullish entry was confirmed by both price and a favorable seasonal trend. The bullish signal was followed by a nice rally.
COT data for individual futures contracts is invaluable. Calculating COT values for futures sectors adds an additional level of confirmation and allows us to understand the positions of commercials and speculators across all futures contracts within each sector. The key to this calculation is using a standardized COT indicator that is not expressed in terms of the number of futures contracts.
Good luck in your trading
Feedback
Your comments, feedback, and questions are always welcome and appreciated. Please use the comment section at the bottom of this page or send me an email.
Do you have any questions about the material? What topics would you like to see in the future?
Referrals
If you found the information on www.TraderEdge.Net helpful, please pass along the link to your friends and colleagues or share the link with your social network.
The "Share / Save" button below contains links to all major social networks. If you do not see your social network listed, use the down-arrow to access the entire list of social networking sites.
Thank you for your support.
Brian Johnson
Copyright 2012 - Trading Insights, LLC - All Rights Reserved.
.


Hello,
I am using also Amibroker but don’t know how to put COT data into ami.
Can you tell me hot you are doing it?
Your chart looks very impressive. For this moment I am using for COT charts:
Timingcharts.com
cotprice.com
upperman.com
insidercapital.com
But it would be great to have it in Amibroker.
Thank you,
Mariusz
Mariusz,
I use CSI Unfair Advantage (see affiliate link in RHS sidebar) as my data source for futures, stocks, and ETFs. CSI also provide the weekly legacy COT data after it is released every Friday. There are probably a number of vendors who provide the COT data in machine-readable form.
I wrote an Excel macro to read the COT data file from CSI and split the data into separate data files for commercials, large speculators, small speculators, and for open interest. The macro also transforms the weekly data into daily data, allowing me to use the COT data in daily charts as well.
Each output file is effectively a separate symbol file in CSV format. This gives me the flexibility to work with the COT data individually or collectively in AmiBroker.
After downloading the COT data from CSI and running the Excel macro, I import the CSV files into AmiBroker (using AmiBroker’s Import Wizard). I then use the AMIBroker Foreign function to read and manipulate the COT data.
My custom COT indicator combines data for commercials, large speculators, small speculators, and open interest into a single standardized indicator. The indicator itself represents a standardized deviation from the “normal” values over the user-specified time horizon.
There are probably easier ways to get the COT data into AMIbroker, but this method works well for me. Please let me know if I can answer any additional questions regarding the COT data.
Thanks for your interest in TraderEdge.Net.
Good luck,
Brian Johnson
Hello,
Thank you for your quick respond. For this moment I found easier way for COT charting with large history. It’s not in Ami but have also good tools.
You can try, it’s for free: COT Wizard 2.0
http://www.informedtrades.com/blogs/jpvtien/3838-cot-wizard-2-0.html
There is probably more good COT charting tools and better than this one but for this moment I haven’t found any thing else.
Thank you,
Mariusz
Mariusz,
Thanks for following up with the COT Wizard suggestion. Having access to COT data in graphical format is a great start, but using the COT data in custom indicators and actual trading strategies (through a platform like AMIBroker) opens up even more possibilities. There is no limit to what you can do when you are able to work with the actual COT data directly.
Thanks,
Brian Johnson