
Would you be interested in an indicator that has signaled ten market tops since 1966 without a single false signal? I read about such an indicator in an article titled "Double Divergences in the Advance-Decline Line," which appeared in the November 2013 issue of Active Trader. The article was written by Charles Kirkpatrick.
In the article, Kirkpatrick presented compelling evidence that double divergences in the cumulative advance-decline line are always followed by large bear market declines. Even more important, Kirkpatrick observed that a double divergence occurred on August 2, 2013. Given that I currently have long equity positions; that certainly got my attention. The following article examines the August 2013 double divergence and explores the implications for the market.
Market Breadth and the Advance-Decline Line
The cumulative advance-decline line is a running total of the number of advancing issues, less the number of declining issues for a specific list of securities. It is typically calculated on the NYSE, NASDAQ, and AMEX exchanges, but it can also be calculated on market indices. The advance-decline line is one of the many market breadth statistics, which are considered to be leading indicators and are widely used to identify major market turning points. If you would like to learn more about market breadth, please revisit one of my favorite articles "The Secret Weapon of Technical Analysis."
Divergences and Double Divergences
Bearish divergences occur when a price series reaches a new high and the predictive indicator does not. Two consecutive divergences are classified as a double divergence. Sounds simple enough, but Kirkpatrick makes a critical observation:
"To ensure a divergence is complete and not the result of a timing difference, wait for both the index and a-d line to peak - that is, confirm a high is in place by moving lower. Sometimes the market index will reach a new high before the a-d line, suggesting a divergence is forming, but then become invalid when the a-d line later confirms the new market index high by making a higher high of its own."
A bearish divergence occurs when the price series makes a higher high and the A-D line makes a lower high, but the highs in the price series and A-D line will not necessarily occur on the same date. This is difficult to explain and challenging to code, but is easy to see on a chart. Let's look at the 2007 double divergence that foretold the 2008 market meltdown.
The top panel in Figure 1 below is a daily candlestick chart of the S&P 500 index from May 2007 to November 2007. The bottom panel is the combined, cumulative A-D line for the NYSE, NASDAQ, and AMEX exchanges. This brings up an important point, large comprehensive data lists produce better leading breadth indicators. As a result, I use the combined breadth statistics for the the NYSE, NASDAQ, and AMEX exchanges when calculating breadth indicators for my systematic strategies.
In June of 2007, both the S&P 500 index and the A-D line made higher highs. The first divergence occurred in July of 2007. The S&P clearly made a higher high and the A-D line made a lower high. The single bearish divergence led to a a sharp pullback, but the S&P 500 index rebounded and hit a new high in October 2007. Now look at the A-D line; it also peaked, but at a much lower level - the definition of a lower high.
This completed the deadly double divergence and correctly signaled the beginning of the great recession. In fact, the double divergence coincided with the high tick in the S&P 500 - the exact market peak. Signals don't get any better than that.
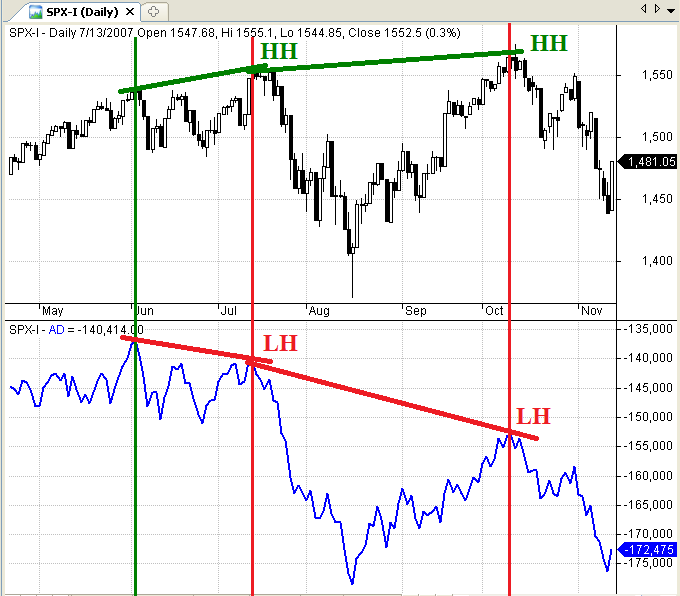
Figure 1: S&P 500 Double Divergence - 2007
2013 Divergence
Now let's look at the chart for 2013. The format for Figure 2 below is the same as Figure 1 above. The top panel in Figure 2 below is a daily candlestick chart of the S&P 500 index from April 2013 to October 2013. The bottom panel is the combined, cumulative A-D line for the NYSE, NASDAQ, and AMEX exchanges.
In May and July of 2013, both the S&P 500 index and the A-D line made higher highs. On August 2, 2013 (less than two weeks later), the S&P 500 made another higher high and the A-D line made a lower high (red vertical line below). This was the first bearish divergence.
After a pullback, the S&P 500 and the A-D line both made higher highs in September and again in October. Technically, October cannot yet be classified as a high because the S&P and the A-D line have not yet declined from their new highs. However, both the S&P 500 and the A-D line will eventually record higher highs.
So where is the double divergence Kirkpatrick identified in his article? It is not present in this data. Why? First Kirkpatrick used an alternative formula for calculating the A-D line (the Ayers A-D line). Second, Kirkpatrick did not mention the list of securities used to calculate the A-D line in his article, but it could have been the S&P 500 index. As I mentioned earlier, when used as a leading indicator, broad definitions of market breadth (NYSE+NASDAQ+AMEX) are much more reliable than narrow definitions (S&P 500).
So we have conflicting signals. Kirkpatrick' methodology recorded the first bearish divergence in late July of 2013 and the second bearish divergence on August 2, 2013. My methodology only recorded a single bearish divergence on August 2, 2013. As you can see below, my broader A-D line made a clear higher high in July 2013.
We have conflicting evidence. Kirkpatrick recorded a double divergence and I recorded a single divergence. So how do we proceed? Fortunately, we do not need to rely on the subjective superiority of one method over the other. Even if we accept Kirkpatrick's double divergence, it was nullified when the S&P 500 and the A-D line made successive higher highs again in September and again in October. If the signal were valid, the A-D line would not have been able to make successive higher highs.
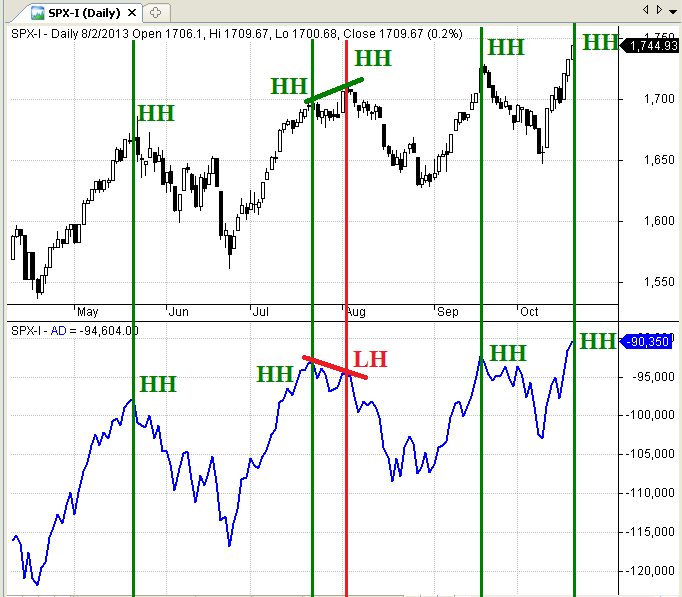
Figure 2: S&P 500 Divergence - 2013
Conclusion
Market breadth statistics are very powerful leading indicators and I use them extensively in my systematic strategies. Using divergences and double divergences leverage the power of breadth statistics even further. Double divergences in the A-D line have been remarkably successful in identifying bear market moves.
Excluding August 2013, Kirkpatrick identified ten double divergences since 1966. Every one led to a significant bear market move. On average, the S&P declined by 31.1% from the double divergence signal date to the market trough. Based on Kirkpatrick's research, the S&P 500 declined by 16.69% to 56.78% from the signal date.
In three instances, the market continued to rally for periods of 9 to 15 months, rising by another 2.63% to 19.8% after the double divergence signals. According to Kirkpatrick, the market failed to rally at all after the other seven double divergence signals. Remarkable!
I recommend using market breadth statistics and plotting bearish divergences and double divergences in your investment process. However, it is critical to use a broad definition of market breadth to enhance the reliability of the resulting forecasts.
In addition, when looking for double divergences, large gaps in time and price are more meaningful than small gaps. In other words, I would be hesitant to rely on a double divergence that occurred in a span of a few trading days. Likewise, a lower high in the A-D line that was only down slightly from the previous high would also be suspect. Notice that the double divergence in 2007 spanned several months and resulted in large declines in the A-D line, which generated a very powerful bearish signal.
Finally, remember that bearish divergence or double divergence signals are nullified when both series record higher highs.
Trader Edge Strategy E-Subscription Now Available: 20% ROR
The Trader Edge Asset Allocation Rotational (AAR) Strategy is a conservative, long-only, asset allocation strategy that rotates monthly among five large asset classes. The AAR strategy has generated 20%+ annual returns over the combined back and forward test period. Please use the above link to learn more about the AAR strategy.
Feedback
Your comments, feedback, and questions are always welcome and appreciated. Please use the comment section at the bottom of this page or send me an email.
Referrals
If you found the information on www.TraderEdge.Net helpful, please pass along the link to your friends and colleagues or share the link with your social or professional networks.
The "Share / Save" button below contains links to all major social and professional networks. If you do not see your network listed, use the down-arrow to access the entire list of networking sites.
Thank you for your support.
Brian Johnson


Did you restrict NYSE to common stocks and strip out all of the bond fund, fixed income etc securities which make up a large number of issues these days?
Aristotle,
You raise a good point. For timing purposes, it would be better to limit the advance-decline (AD) data to equity securities.
CSI is my data vendor and I am using their UVDV series for the NYSE AD data. UVDV is the only CSI series I have found for NYSE AD data. As a result, I assume it includes all NYSE issues.
I will contact CSI and ask them if they will add the AD series for NYSE equity only securities. They have been very responsive to new data series requests in the past.
Thanks,
Brian Johnson