
Volatility has increased significantly in the last few weeks and traders are now in panic mode. The best way to avoid panic is to use a simple, systematic, back-tested strategy that has proven to to be successful over decades. In June of 2012 I wrote an article titled "Take the First Step Toward an Investment Process."
In that article, I used the S&P 500 index (SPX) and the NASDAQ 100 index (NDX) to demonstrate that a "17-month moving average strategy outperformed the buy-and-hold approach for periods beginning in 1950, 1960, 1970, 1980, 1990, and 2000. For each of those periods, the maximum drawdown for the 17-month moving average strategy was dramatically lower than the corresponding maximum drawdown for the buy-and-hold approach." In other words, it had higher returns AND less risk. Why would anyone NOT use this type of strategy?
Current Market Environment
Why am I bringing this up now? Because the SPX just closed below its 17-month moving average, which indicates that cash is currently more attractive than the SPX on a risk-adjusted basis. Figure 1 below is a monthly candlestick chart of the SPX. The Blue, Green, and Purple lines represent 8-month, 13-month, and 17-month moving averages. As you can see from the chart, the SPX closed below all three monthly moving averages.
I included several moving averages lines to illustrate how weak the SPX looks versus a wide range of moving average decision rules. As I pointed out in the article, many moving average signal rules would generate better risk-adjusted returns than buy-and-hold strategies.
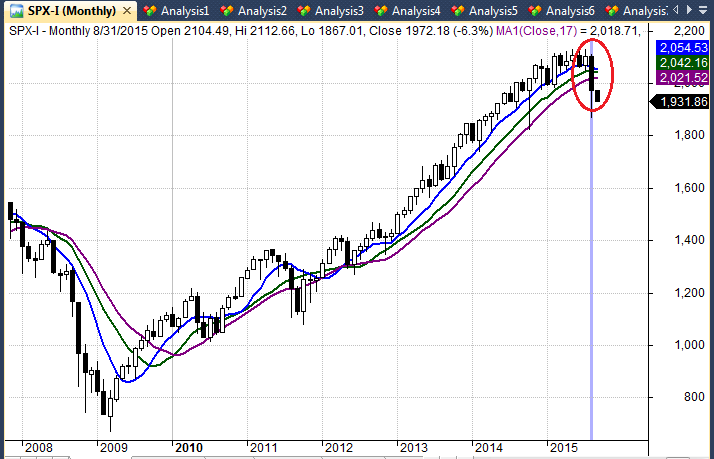
Figure 1: S&P 500 Index on 8/31/2015
Q & A
What about the pull-backs in 2010, 2011, and 2012? In hindsight, those would have been outstanding buying opportunities. True, but that is with perfect hindsight. There would have been a small opportunity cost in selling, but all of the moving average systems would have quickly reentered the market and enjoyed the rally from 2012 to 2015.
What about other equity markets? Is the weakness limited to the SPX? Unfortunately, no. With the exception of a few domestic market sectors, most equity markets are much weaker than the SPX, especially the foreign equity markets. The 17-month strategy would have exited those markets months or even years ago.
If the market rebounds, doesn't that mean the sell signal was wrong? No it does not. Investment decisions should not be evaluated on the success or failure of specific trades. If that was the appropriate metric, then I should wager my entire IRA at the blackjack table, because I was fortunate enough to buck the odds and win some money the last time I was in Vegas.
Investment decisions should be evaluated on the quality and integrity of the decision making framework, not on the outcome of one specific trade.
Conclusion
The best way to avoid large, painful, emotional drawdowns in your portfolio is to use a proven systematic strategy. The 17-month moving average is just one example of many simple systematic strategies that outperform buy-and-hold investing on a risk-adjusted basis.
The latest Trader Edge recession model is not currently indicating a recession, but the next Global recession may not be led by the US economy. It might be led by China. Market prices lead economic indicators and the market price action is speaking very loudly. Are you listening?
Print and Kindle Versions of Brian Johnson's 2nd Book are Available on Amazon (75% 5-Star Reviews)
Print and Kindle Versions of Brian Johnson's 1st Book are Available on Amazon (79% 5-Star Reviews)
Trader Edge Strategy E-Subscription Now Available: 20% ROR
The Trader Edge Asset Allocation Rotational (AAR) Strategy is a conservative, long-only, asset allocation strategy that rotates monthly among five large asset classes. The AAR strategy has generated annual returns of approximately 20% over the combined back and forward test period. Please use the above link to learn more about the AAR strategy.
Brian Johnson
Copyright 2015 - Trading Insights, LLC - All Rights Reserved.


Pingback: China’s Economic Growth is Actually Negative | Trader Edge