
The following article updates the diffusion index, recession slack index, aggregate recession model, and aggregate peak-trough model through December 2015. Over the past 12 months, I added a number of new economic and market-based variables with very strong explanatory power to the recession model (including one at the end of December). This allowed me to cull three of the original independent variables with the weakest historical performance and most questionable cause and effect recessionary influence. The current 20-variable model has a diverse set of explanatory variables and is quite robust.
Each of the explanatory variables has predictive power individually; when combined together, the group of indicators is able to identify early recession warnings from a wide range of diverse market-based, fundamental, technical, and economic sources. After the latest additions and deletions, the total number of explanatory recession model variables is now 20. The current and historical data in this report reflect the current model configuration with all 20 variables.
Diffusion Index
The Trader Edge diffusion index equals the percentage of independent variables indicating a recession. With the recent changes, there are now a total of 20 explanatory variables, each with a unique look-back period and recession threshold. The resulting diffusion index and changes in the diffusion index are used to calculate the probit, logit, and neural network model forecasts.
The graph of the diffusion index from 1/1/2006 to 01/1/2016 is presented in Figure 1 below (in red - left axis). The gray shaded regions in Figure 1 below represent U.S. recessions as defined (after the fact) by the National Bureau of Economic Research (NBER). The value of the S&P 500 index is also included (in blue - right axis).
In December 2014, for the first time since December 2012, one of the 20 explanatory variables indicated a recessionary environment. The number of variables indicating a recession varied between zero and one from December 2014 through May 2015 and between one and two from June 2015 through November 2015. The number of variables indicating a recession jumped from two in November to five in December, which is the highest diffusion index value since the end of 2011.
The diffusion index remained positive throughout most of 2015, which was troubling. The large spike to five in December is much more serious. Unless the market stages a significant rally in the last week of January, one or more market-based explanatory variables would move into recession territory next month. If that happens (and no other variables fall below their recession thresholds), it would constitute the highest diffusion index reading (6/20) since the Great Recession. Going back to 1959, diffusion index readings of six or more have always been associated with U.S. recessions. In other words, the diffusion index has only reached a level of six shortly before, during, or after NBER recessions.
In non-recessionary environments, weakness typically persists for a few months and then dissipates. However, if the weakness becomes more widespread or lingers for many months, that can be more problematic. The weakness persisted throughout much of 2015 at a relatively modest level, but has now jumped alarmingly. We are nearing a tipping point.
Please note that past estimates and index values will change whenever the historical data is revised. All current and past forecasts and index calculations are based on the latest revised data from the current data set.
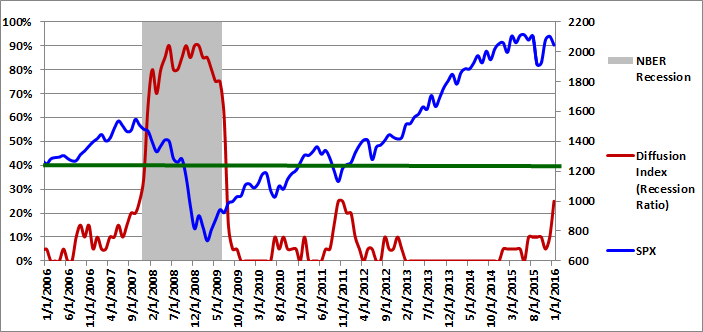
Figure 1: Diffusion Index 01-01-2016
Recession Slack Index
The Trader Edge recession slack index equals the median standardized deviation of the current value of the explanatory variables from their respective recession thresholds. The resulting value signifies the amount of slack or cushion relative to the recession threshold, expressed in terms of the number of standard deviations.
The gray shaded regions in Figure 2 below represent U.S. recessions as defined (after the fact) by the NBER. The median recession slack index is depicted in purple and is plotted against the right axis, which is expressed as the number of standard deviations above the recession threshold.
The dark-red, horizontal line at 0.50 standard deviations denotes a possible warning threshold for the recession slack index. Many of the past recessions began when the recession slack index crossed below 0.50. Similarly, many of the past recessions ended when the recession slack index crossed back above 0.0.
In mid-2014, the revised median recession slack index peaked at 1.21, far above the warning level of 0.50. The revised values of the recession slack index declined alarmingly to 0.68 in March 2015, perilously close to the early warning level of 0.50. The value of 0.68 matched the lowest value recorded since the end of the Great Recession. The median recession slack index remained between 0.97 and 0.94 from April through July 2015, and between 0.80 and 0.82 from August through November 2015. In December 2015, the slack index dropped back to 0.68, again matching its lowest level since the end of the Great Recession. The cushion above the warning level has shrunk considerably since mid-2014 and the slack index is now only marginally above its warning threshold.
The ability to track small variations and trend changes over time illustrates the advantage of monitoring the continuous recession slack index in addition to the diffusion index above, which moves in discrete steps.
While it is useful to track the actual recession slack index values directly, the values are also used to generate the more intuitive probit and logit probability forecasts.
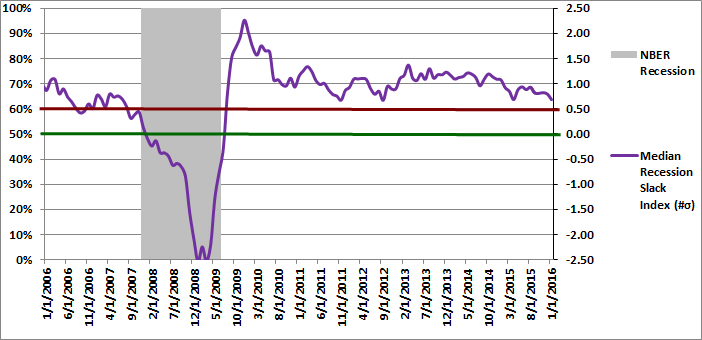
Figure 2: Median Recession Slack Index 01-01-2016
Aggregate Recession Probability Estimate
The Trader Edge aggregate recession model is the average of four models: the probit and logit models based on the diffusion index and the probit and logit models based on the recession slack index. The aggregate recession model estimates from 1/1/2006 to 01/01/2016 are depicted in Figure 3 below (red line - left vertical axis). The gray shaded regions represent NBER recessions and the blue line reflects the value of the S&P 500 index (right vertical axis). I suggest using a warning threshold of between 30-40% for the aggregate recession model (green horizontal line).
The aggregate recession model probability estimate for 01/01/2016 increased from 0.1% in November to 3.6% in December 2015. According to the model, the probability that the U.S. is currently in a recession continues to be remote.
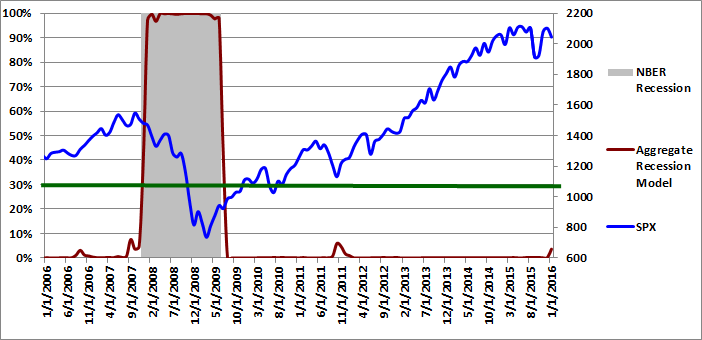
Figure 3: Aggregate Recession Model 01-01-2016
Aggregate Peak-Trough Probability Estimate
The peak-trough model forecasts are different from the recession model. The peak-trough models estimate the probability of the S&P 500 being between the peak and trough associated with an NBER recession. The S&P 500 typically peaks before recessions begin and bottoms out before recessions end. As a result, it is far more difficult for the peak-trough model to fit this data and the model forecasts have larger errors than the recession model.
The Trader Edge aggregate peak-trough model equals the weighted-average of nine different models: the probit and logit models based on the diffusion index, the probit and logit models based on the recession slack index, and five neural network models.
The aggregate peak-trough model estimates from 1/1/2006 to 1/01/2016 are depicted in Figure 4 below, which uses the same format as Figure 3, except that the shaded regions represent the periods between the peaks and troughs associated with NBER recessions.
The aggregate peak-trough model probability estimate for 01/01/2013 was 29.2%, which is up sharply (+19.9%) from the revised value of 9.3% at the end of November. With the exception of one month in late 2011, the value of 29.2% was the highest reading since the end of the Great Recession. If current market levels hold, it is likely that this probability will increase again at the end of January 2016.
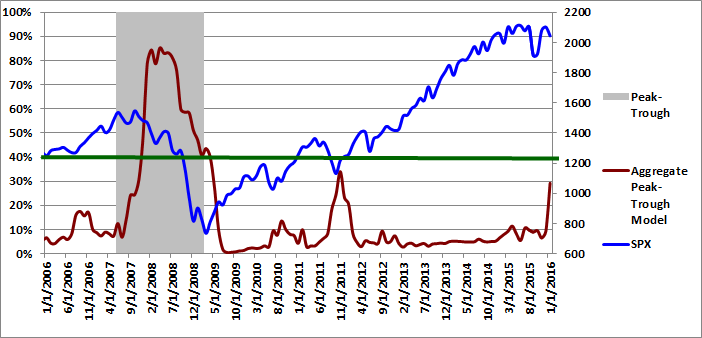
Figure 4: Aggregate Peak-Trough Model 01-01-2016
Conclusion
December 2015 marked the most significant increase in U.S. recession risk since late 2011. The diffusion index increased to 5/20 in December, its highest value since late 2011. To make mattes worse, at least one additional explanatory variable is currently above its recession threshold (month-to-date January). This is particularly important, given that the diffusion index has never reached 6/20 outside of a recessionary environment.
The use of several market-based indicators makes the Trader Edge recession model more responsive. Relative to traditional economic variables, market-based data have important advantages: they are highly predictive, they are never restated, and there is no lag in receiving the data. The five diffusion index variables above their recession thresholds at the end of December include market-based and non-market-based data.
In March 2015, the recession slack index matched its lowest level since the end of the Great Recession (0.68). It rebounded briefly in subsequent months, but has again dropped back to 0.68. The peak-trough recession probability estimate increased sharply in December, ending the month at 29.2%. All of the recession forecasts remain inside their respective warning thresholds, but we could be approaching a tipping point.
Given the close proximity of a few diffusion index variables relative to their respective recession thresholds, the recession model forecasts over the next few months will continue to be very telling.
Print and Kindle Versions of Brian Johnson's 2nd Book are Available on Amazon (75% 5-Star Reviews)
Print and Kindle Versions of Brian Johnson's 1st Book are Available on Amazon (79% 5-Star Reviews)
Trader Edge Strategy E-Subscription Now Available: 20% ROR
The Trader Edge Asset Allocation Rotational (AAR) Strategy is a conservative, long-only, asset allocation strategy that rotates monthly among five large asset classes. The AAR strategy has generated annual returns of approximately 20% over the combined back and forward test period. Please use the above link to learn more about the AAR strategy.
Feedback
Your comments, feedback, and questions are always welcome and appreciated. Please use the comment section at the bottom of this page or send me an email.
Referrals
If you found the information on www.TraderEdge.Net helpful, please pass along the link to your friends and colleagues or share the link with your social or professional networks.
The "Share / Save" button below contains links to all major social and professional networks. If you do not see your network listed, use the down-arrow to access the entire list of networking sites.
Thank you for your support.
Brian Johnson
Copyright 2016 - Trading Insights, LLC - All Rights Reserved.


Pingback: Non-Farm Payroll (NFP) Model Forecast – January 2016 | Trader Edge