
The following article updates the diffusion index, recession slack index, aggregate recession model, and aggregate peak-trough model through February 2016. Throughout 2015, I added a number of new economic and market-based variables with very strong explanatory power to the recession model. This allowed me to cull three of the original independent variables with the weakest historical performance and most questionable cause and effect recessionary influence. I added one new variable with surprisingly strong explanatory power at the end of February 2016. The current 21-variable model has a diverse set of explanatory variables and is quite robust.
Each of the explanatory variables has predictive power individually; when combined together, the group of indicators is able to identify early recession warnings from a wide range of diverse market-based, fundamental, technical, and economic sources. After the latest additions and deletions, the total number of explanatory recession model variables is now 21. The current and historical data in this report reflect the current model configuration with all 21 variables.
Diffusion Index
The Trader Edge diffusion index equals the percentage of independent variables indicating a recession. With the recent changes, there are now a total of 21 explanatory variables, each with a unique look-back period and recession threshold. The resulting diffusion index and changes in the diffusion index are used to calculate the probit, logit, and neural network model forecasts.
The graph of the diffusion index from 1/1/2006 to 03/1/2016 is presented in Figure 1 below (in red - left axis). The gray shaded regions in Figure 1 below represent U.S. recessions as defined (after the fact) by the National Bureau of Economic Research (NBER). The value of the S&P 500 index is also included (in blue - right axis).
In December 2014, for the first time since December 2012, one of the 21 explanatory variables indicated a recessionary environment. The number of variables indicating a recession varied between zero and one from December 2014 through May 2015 and between two and three from June 2015 through November 2015. The number of variables indicating a recession jumped from three in November, to six in December, to eight in January 2016, but dropped back to seven in February. Seven out of 21 explanatory variables (33.3%) are now indicating a recession which is the highest diffusion index value since the end of of the Great Recession, except for last month (38.1%).
The diffusion index remained positive throughout most of 2015, which was troubling. The large spike to seven (33.3%) in February is much more serious. Going back to 1959, diffusion index readings of 33.3% have always been associated with U.S. recessions. In other words, the diffusion index has only reached a level of 33.3% shortly before, during, or after NBER recessions.
In non-recessionary environments, weakness typically persists for a few months and then dissipates. However, if the weakness becomes more widespread or lingers for many months, that can be more problematic. The weakness persisted throughout much of 2015 at a relatively modest level, but now exceeds past recessionary levels.
As I have explained before, several of the explanatory variables are market-based. These variables respond very quickly to changing market conditions and are never revised. In addition, this also makes it possible for me to take a preliminary look inside the model to estimate how recent market movements might affect the model next month.
Given that the recession risk remains at a tipping point, I examined the impact of the dramatic month-to-date rally in March on each of the market variables. As of mid-March, only three out of 21 explanatory variables would have been at recession levels - a drop of four since the end of February.
That's the good news. The bad news is that three of those four variables remain within 0.10 standard errors of their respective recession thresholds, even after the rally. In addition, there is no guarantee that the market will be able to hold its gains through the end of March.
Please note that past estimates and index values will change whenever the historical data is revised. All current and past forecasts and index calculations are based on the latest revised data from the current data set.
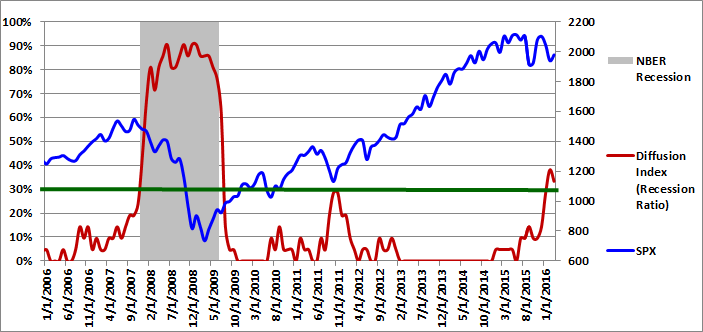
Figure 1: Diffusion Index 03-01-2016
Recession Slack Index
The Trader Edge recession slack index equals the median standardized deviation of the current value of the explanatory variables from their respective recession thresholds. The resulting value signifies the amount of slack or cushion relative to the recession threshold, expressed in terms of the number of standard deviations.
The gray shaded regions in Figure 2 below represent U.S. recessions as defined (after the fact) by the NBER. The median recession slack index is depicted in purple and is plotted against the right axis, which is expressed as the number of standard deviations above the recession threshold.
The dark-red, horizontal line at 0.50 standard deviations denotes a possible warning threshold for the recession slack index. Many of the past recessions began when the recession slack index crossed below 0.50. Similarly, many of the past recessions ended when the recession slack index crossed back above 0.0.
In mid-2014, the revised median recession slack index peaked at 1.18, far above the warning level of 0.50. The revised values of the recession slack index declined alarmingly to 0.82 in March 2015, approaching the early warning level of 0.50. The median recession slack index remained between 0.82 and 0.94 from April through July 2015, before dropping to 0.67 in August 2015. In December 2015, the slack index dropped to 0.54 and fell even more sharply in January to 0.38, penetrating the warning level of 0.50 for the first time since the Great Recession. The slack index bounced back to 0.56 in February, slightly above the warning level. If the recent market gains hold, the slack index would probably increase further next month.
The ability to track small variations and trend changes over time illustrates the advantage of monitoring the continuous recession slack index in addition to the diffusion index above, which moves in discrete steps.
While it is useful to track the actual recession slack index values directly, the values are also used to generate the more intuitive probit and logit probability forecasts.
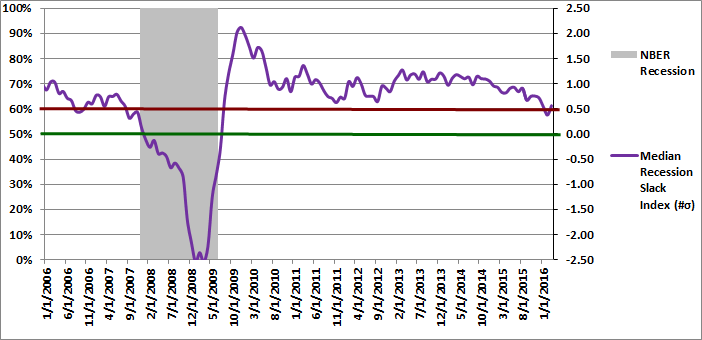
Figure 2: Median Recession Slack Index 03-01-2016
Aggregate Recession Probability Estimate
The Trader Edge aggregate recession model is the average of four models: the probit and logit models based on the diffusion index and the probit and logit models based on the recession slack index. The aggregate recession model estimates from 1/1/2006 to 03/01/2016 are depicted in Figure 3 below (red line - left vertical axis). The gray shaded regions represent NBER recessions and the blue line reflects the value of the S&P 500 index (right vertical axis). I suggest using a warning threshold of between 20-30% for the aggregate recession model (green horizontal line).
The aggregate recession model probability estimate for 03/01/2016 decreased from 28.6% in January 2016 to 14.7% in February 2016. According to the model, the probability that the U.S. is currently in a recession declined materially last month, but the current value of 14.7% still represents the second highest reading since the end of the Great Recession.
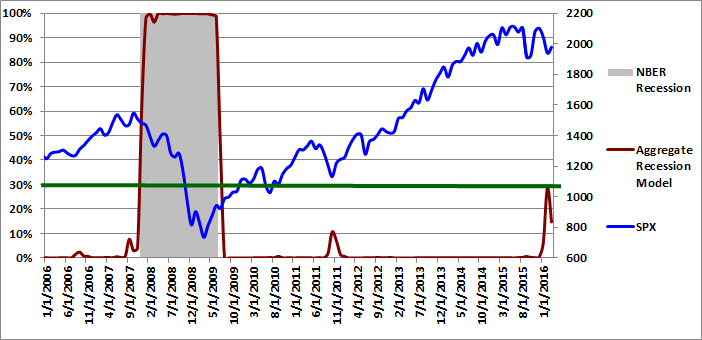
Figure 3: Aggregate Recession Model 03-01-2016
Aggregate Peak-Trough Probability Estimate
The peak-trough model forecasts are different from the recession model. The peak-trough models estimate the probability of the S&P 500 being between the peak and trough associated with an NBER recession. The S&P 500 typically peaks before recessions begin and bottoms out before recessions end. As a result, it is far more difficult for the peak-trough model to fit this data and the model forecasts have larger errors than the recession model.
The Trader Edge aggregate peak-trough model equals the weighted-average of nine different models: the probit and logit models based on the diffusion index, the probit and logit models based on the recession slack index, and five neural network models.
The aggregate peak-trough model estimates from 1/1/2006 to 3/01/2016 are depicted in Figure 4 below, which uses the same format as Figure 3, except that the shaded regions represent the periods between the peaks and troughs associated with NBER recessions.
The aggregate peak-trough model probability estimate for 03/01/2016 was 36.4%, which is down significantly from the revised value of 50.5% at the end of January 2016. The value of 50.5% was (by far) the highest reading since the end of the Great Recession and the current value of 36.4% is the second highest value.
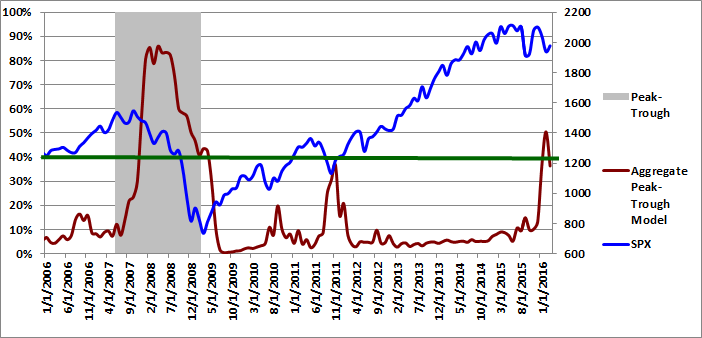
Figure 4: Aggregate Peak-Trough Model 03-01-2016
Conclusion
January 2016 marked a potential tipping point in U.S. recession risk, but that risk declined in February. If recent market gains hold, the risk of a U.S. recession would decrease even further in March. Nevertheless, the latest diffusion index reading of 33.3% remains at or above past recessionary levels. Going back to 1959, diffusion index readings of 33.3% have always been associated with U.S. recessions.
The use of several market-based indicators makes the Trader Edge recession model more responsive than many other models. Relative to traditional economic variables, market-based data have important advantages: they are highly predictive, they are never restated, and there is no lag in receiving the data. The seven diffusion index variables above their recession thresholds at the end of January include market-based and non-market-based data.
The latest median recession slack index value of 0.56 is stronger than last month, but is still perilously close to the early warning threshold. The probability that the U.S. is currently in a recession dropped to 14.7% in February, but still represents the second-highest reading since the end of the Great Recession. Finally, the peak-trough recession probability estimate also declined in February 2016, but it too represented the second-highest reading since the end of the Great Recession.
Many of the the above readings are at or above past recessionary levels and we remain at a tipping point. The large rebound in the price of risk-assets in March is encouraging and could positively influence several explanatory variables next month. Nevertheless, U.S. recession risk has grown alarmingly. Given that the equity market was significantly overvalued entering this period and the fact that corporate earnings have declined for three consecutive quarters, the downside risk is still significant.
Unlike human prognosticators, the Trader Edge recession model is completely objective and has no ego. It is not burdened by the emotional need to defend past erroneous forecasts and will always accurately apply the insights gained from new data. As a result, if economic and market conditions continue to improve over the next few months, the recession probabilities will continue to drop accordingly. Conversely, if the contagion spreads to the remaining explanatory variables, the recession model will objectively quantify the increased recession risk. We are not out of the woods yet. Stay tuned.
Print and Kindle Versions of Brian Johnson's 2nd Book are Available on Amazon (75% 5-Star Reviews)
Print and Kindle Versions of Brian Johnson's 1st Book are Available on Amazon (79% 5-Star Reviews)
Trader Edge Strategy E-Subscription Now Available: 20% ROR
The Trader Edge Asset Allocation Rotational (AAR) Strategy is a conservative, long-only, asset allocation strategy that rotates monthly among five large asset classes. The AAR strategy has generated annual returns of approximately 20% over the combined back and forward test period. Please use the above link to learn more about the AAR strategy.
Feedback
Your comments, feedback, and questions are always welcome and appreciated. Please use the comment section at the bottom of this page or send me an email.
Referrals
If you found the information on www.TraderEdge.Net helpful, please pass along the link to your friends and colleagues or share the link with your social or professional networks.
The "Share / Save" button below contains links to all major social and professional networks. If you do not see your network listed, use the down-arrow to access the entire list of networking sites.
Thank you for your support.
Brian Johnson
Copyright 2016 - Trading Insights, LLC - All Rights Reserved.


You are to be applauded for this sophisticated work. The merit is in the objectivity and comprehensiveness (though there is also much to be said for culling the number of model indicators down to the bare minimum). Also applaud for the clarity and completeness of your technical write-up.
This is not like applying mathematics to a single market price. As it is the critical down phase of the vast complex economy you are trying to forecast, the difficulty is a magnitude greater. Vital over the long haul is avoiding false signals.
Pre Great Crisis, it was relatively easy to call the peak of the cycle in advance. Of course, the lead time varied from cycle to cycle. But crisp calls without false signals were possible. As for calling the trough of the cycle, that was like shooting fish in a barrel. Lead time tight around 3 months, so those calls were quite solid though of short warning time relative to calls at the tops.
Now for the other shoe. Due to gross distortion of all markets because of ZIRP and the QEs, today’s post-crisis world is different than anything that came before. Since you are working with time series that comingle pre and post crisis data, this is a problem. Even simple raw data like the U-3 unemployment rate are not truly comparable pre and post. Some of the sting comes out by using differences rather than levels. But the task is still a thorny one. As a gross simplification, today’s is a more nonlinear world where traditional pre-crisis relationships do not hold with the same rigor.
Your models’ signals in January told a story of recession imminent in 2016. Then, however, immediately they were broadsided by the globe’s four major central banks jointly over a 60-day span engaging in another round of easing. This is unprecedented in all of history. It can-kicked the recession down the road, and we know not how far. It remains to be seen whether those January signals were correct. Only time (upcoming months) will tell. At this point the art of art & science enters the story. The art consists of overlaying a template atop the models’ science. Deep understanding of the economy is necessary. If bluntly honest, we must admit it is not humanly possible to know when this house of cards will tumble. Central banks have the means to continually patch it together, though with dramatically lessening efficacy after each new round of policy easing. We are approaching the point where diminishing returns to policy actions become negative returns. Yet with the present state of science cannot know exactly when.
What is probably going to happen is a lightning bolt out of the blue. Some part of the financial edifice will collapse and contagion will bring down the rest. Your models will capture this when it happens, but recession will come very closely on the heels of the lightening. Much like the sound follows the flash. As best I can tell, you have developed an excellent near warning system. The larger task is to develop a reasonable distant warning system. Perhaps with this insight in mind you can go back over all the infinite detail and ferret out something wholly new you had not previously seen. As you might imagine, I am at work on this very task. You will benefit from a close read of Shattered Sword: The Untold Story of the Battle of Midway. This is exactly what the Japanese did not do. They failed precisely with regard to redundancy in their otherwise sensible warning system designed to detect the US Pacific fleet that sailed just over the horizon very much out of sight. We know how that ended …
JPH,
Thank you for your detailed and well reasoned comments. I agree that the large and discrete global central bank interventions have made it more difficult to identify recessions. With respect to the number of variables, I would normally agree that reducing the number of variables is preferable, but not necessarily with the diffusion index. By including more variables, each significant individually, the diffusion index is able to detect increase in recession risk from a wide range of sources. Not all recessions are the same and different explanatory variables will turn earlier in different environments.
With respect to the January 2016 recession forecast, the peak-trough forecast was approximately 50% and the current recession probability was significantly less. Both of these values were indicative of a pending recession based on past values, but the peak-trough probability was still a coin flip.
The next few months should be interesting and the Trader Edge recession model probabilities will continue to respond to the latest data. I would be interested in seeing the results of your research efforts. I find it very useful to have access to objective and unbiased recession forecasts when trading.
Regards,
Brian Johnson