
The following article updates the diffusion index, recession slack index, aggregate recession model, and aggregate peak-trough model through March 2016. Throughout 2015, I added a number of new economic and market-based variables with very strong explanatory power to the recession model. This allowed me to cull three of the original independent variables with the weakest historical performance and most questionable cause and effect recessionary influence. I added one new variable with surprisingly strong explanatory power at the end of February 2016. The current 21-variable model has a diverse set of explanatory variables and is quite robust.
Each of the explanatory variables has predictive power individually; when combined together, the group of indicators is able to identify early recession warnings from a wide range of diverse market-based, fundamental, technical, and economic sources. After the latest additions and deletions, the total number of explanatory recession model variables is now 21. The current and historical data in this report reflect the current model configuration with all 21 variables.
Diffusion Index
The Trader Edge diffusion index equals the percentage of independent variables indicating a recession. With the recent changes, there are now a total of 21 explanatory variables, each with a unique look-back period and recession threshold. The resulting diffusion index and changes in the diffusion index are used to calculate the probit, logit, and neural network model forecasts.
The graph of the diffusion index from 1/1/2006 to 04/1/2016 is presented in Figure 1 below (in red - left axis). The gray shaded regions in Figure 1 below represent U.S. recessions as defined (after the fact) by the National Bureau of Economic Research (NBER). The value of the S&P 500 index is also included (in blue - right axis).
In December 2014, for the first time since December 2012, one of the 21 explanatory variables indicated a recessionary environment. The number of variables indicating a recession varied between one and two from December 2014 through June 2015 and between two and three from June 2015 through November 2015. The number of variables indicating a recession jumped from three in November, to six in December, to eight in January 2016 and remained at eight in February. In response to the robust market environment in March, the number of explanatory variables indicating a recession dropped to five (23.8%) in March.
As I have explained before, several of the explanatory variables are market-based. These variables respond very quickly to changing market conditions and are never revised. This makes the Trader Edge recession model much more responsive than other recession models. The sharp rebound in the price of risk-assets improved the U.S. economic outlook - at least temporarily, but recession risk remains near a tipping point. The trend in the explanatory variables over the next few months will be very instructive.
Please note that past estimates and index values will change whenever the historical data is revised. All current and past forecasts and index calculations are based on the latest revised data from the current data set.
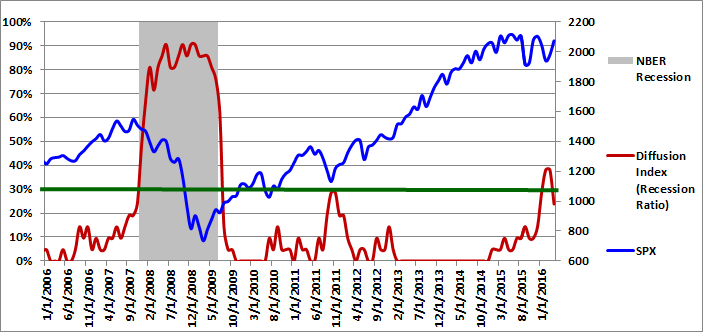
Figure 1: Diffusion Index 04-01-2016
Recession Slack Index
The Trader Edge recession slack index equals the median standardized deviation of the current value of the explanatory variables from their respective recession thresholds. The resulting value signifies the amount of slack or cushion relative to the recession threshold, expressed in terms of the number of standard deviations.
The gray shaded regions in Figure 2 below represent U.S. recessions as defined (after the fact) by the NBER. The median recession slack index is depicted in purple and is plotted against the right axis, which is expressed as the number of standard deviations above the recession threshold.
The dark-red, horizontal line at 0.50 standard deviations denotes a possible warning threshold for the recession slack index. Many of the past recessions began when the recession slack index crossed below 0.50. Similarly, many of the past recessions ended when the recession slack index crossed back above 0.0.
In mid-2014, the revised median recession slack index peaked at 1.17, far above the warning level of 0.50. The revised values of the recession slack index declined alarmingly to 0.70 in March 2015, approaching the early warning level of 0.50. The median recession slack index remained between 0.84 and 0.89 from April through July 2015, but dropped throughout the remainder of 2015. In December 2015, the slack index declined to 0.54 and fell even more sharply to 0.38 in January and 0.31 in February, penetrating the warning level of 0.50 for the first time since the Great Recession. The slack index bounced back to 0.58 in March, slightly above the warning level.
The ability to track small variations and trend changes over time illustrates the advantage of monitoring the continuous recession slack index in addition to the diffusion index above, which moves in discrete steps.
While it is useful to track the actual recession slack index values directly, the values are also used to generate the more intuitive probit and logit probability forecasts.
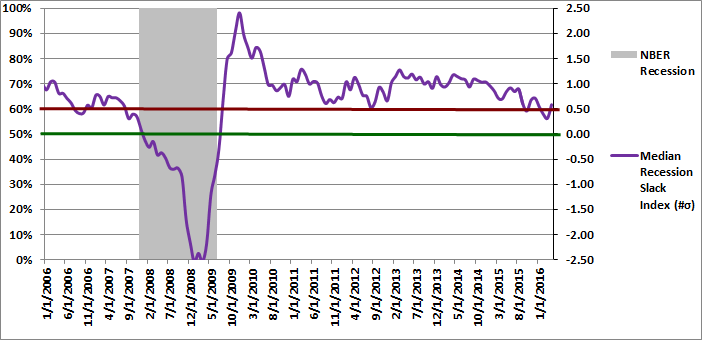
Figure 2: Median Recession Slack Index 04-01-2016
Aggregate Recession Probability Estimate
The Trader Edge aggregate recession model is the average of four models: the probit and logit models based on the diffusion index and the probit and logit models based on the recession slack index. The aggregate recession model estimates from 1/1/2006 to 04/01/2016 are depicted in Figure 3 below (red line - left vertical axis). The gray shaded regions represent NBER recessions and the blue line reflects the value of the S&P 500 index (right vertical axis). I suggest using a warning threshold of between 20-30% for the aggregate recession model (green horizontal line).
The aggregate recession model probability estimate for 04/01/2016 decreased sharply from 31.1% in February 2016 to only 2.3% in March 2016. According to the model, the probability that the U.S. is currently in a recession declined materially last month. This is due to the fact that the model evaluates the level and change in the diffusion index.
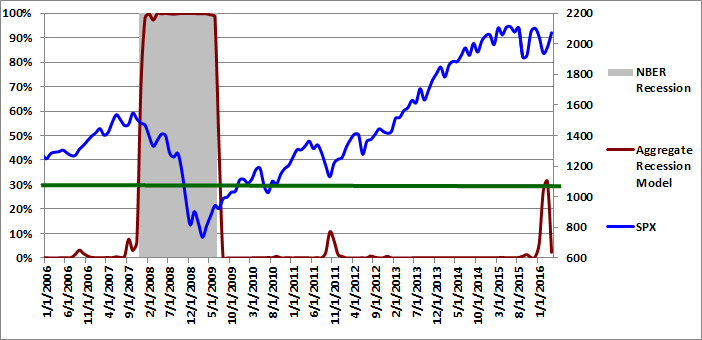
Figure 3: Aggregate Recession Model 04-01-2016
Aggregate Peak-Trough Probability Estimate
The peak-trough model forecasts are different from the recession model. The peak-trough models estimate the probability of the S&P 500 being between the peak and trough associated with an NBER recession. The S&P 500 typically peaks before recessions begin and bottoms out before recessions end. As a result, it is far more difficult for the peak-trough model to fit this data and the model forecasts have larger errors than the recession model.
The Trader Edge aggregate peak-trough model equals the weighted-average of nine different models: the probit and logit models based on the diffusion index, the probit and logit models based on the recession slack index, and five neural network models.
The aggregate peak-trough model estimates from 1/1/2006 to 4/01/2016 are depicted in Figure 4 below, which uses the same format as Figure 3, except that the shaded regions represent the periods between the peaks and troughs associated with NBER recessions.
The aggregate peak-trough model probability estimate for 04/01/2016 was 16.6%, which is down significantly from the revised value of 42.9% at the end of February 2016. The large reduction in recession risk reflects the sharp one-month decline in the diffusion index from 38.1% to 23.8%.
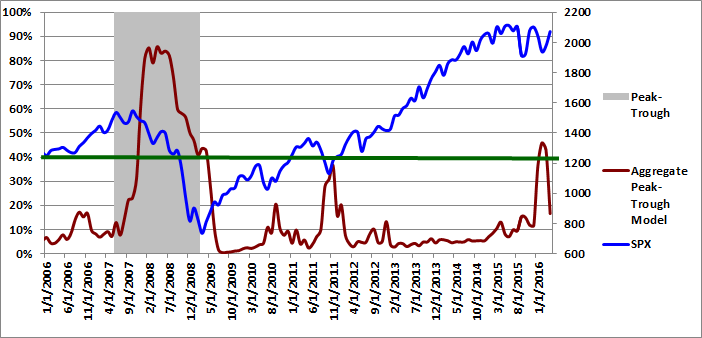
Figure 4: Aggregate Peak-Trough Model 04-01-2016
Conclusion
January and February 2016 marked a potential tipping point in U.S. recession risk, but that risk declined significantly in March.
The use of several market-based indicators makes the Trader Edge recession model more responsive than many other models. Relative to traditional economic variables, market-based data have important advantages: they are highly predictive, they are never restated, and there is no lag in receiving the data. The market-based variables improved in March. Interestingly, there was some deterioration in several of the leading economic indicators.
The latest median recession slack index value of 0.58 is stronger than last month, but is still perilously close to the early warning threshold. The large rebound in the price of risk-assets in March is encouraging and positively influence several explanatory variables last month. Nevertheless, five out of 21 explanatory variables are still indicating a U.S. recession. Given that the equity market was significantly overvalued entering this period and the fact that corporate earnings have declined for three (and probably four) consecutive quarters, the downside risk is still significant.
Unlike human prognosticators, the Trader Edge recession model is completely objective and has no ego. It is not burdened by the emotional need to defend past erroneous forecasts and will always accurately apply the insights gained from new data. As a result, if economic and market conditions continue to improve over the next few months, the recession probabilities will continue to drop accordingly. Conversely, if the contagion spreads to the remaining explanatory variables, the recession model will objectively quantify the increased recession risk. Stay tuned.
Print and Kindle Versions of Brian Johnson's 2nd Book are Available on Amazon (75% 5-Star Reviews)
Print and Kindle Versions of Brian Johnson's 1st Book are Available on Amazon (79% 5-Star Reviews)
Trader Edge Strategy E-Subscription Now Available: 20% ROR
The Trader Edge Asset Allocation Rotational (AAR) Strategy is a conservative, long-only, asset allocation strategy that rotates monthly among five large asset classes. The AAR strategy has generated annual returns of approximately 20% over the combined back and forward test period. Please use the above link to learn more about the AAR strategy.
Feedback
Your comments, feedback, and questions are always welcome and appreciated. Please use the comment section at the bottom of this page or send me an email.
Referrals
If you found the information on www.TraderEdge.Net helpful, please pass along the link to your friends and colleagues or share the link with your social or professional networks.
The "Share / Save" button below contains links to all major social and professional networks. If you do not see your network listed, use the down-arrow to access the entire list of networking sites.
Thank you for your support.
Brian Johnson
Copyright 2016 - Trading Insights, LLC - All Rights Reserved.


Pingback: Bulls Beware | Trader Edge