
In the past, I published the Trader Edge Recession Model every month. After finalizing and rolling out the 32-bit and 64-bit versions of a new comprehensive option volatility forecasting platform called AI Volatility Edge (AIVE) and publishing my latest book (Trading Option Volatility), I have been focusing exclusively on my trading and proprietary research. As a result, I suspended the monthly recession model publication.
Due to increasing coverage of yield curve inversions, rapid inflation, rising interest rates, war in Ukraine, sanctions on Russia, and the prospective increase in recession risk, I decided to carve out the requisite time from my trading and research to publish the March 2022 recession model update.
The war only began in late February, so the full economic impact of the war and the resulting sanctions will not be fully reflected in the data for several months. The same is not true regarding inflation, the less accommodative Fed policy, and the rise in interest rates, all of which have been anticipated for months.
Monthly Update
This article updates the diffusion indices, recession slack index, aggregate recession model, and aggregate peak-trough model as of March 2022.
The current 26-variable model has a diverse set of explanatory variables and is quite robust. Each of the explanatory variables has predictive power individually; when combined, the group of indicators is able to identify early recession warnings from a wide range of diverse market-based, fundamental, technical, and economic sources.
Several of the explanatory variables are market-based. These variables are available in real-time (no lag), which means they respond very quickly to changing market conditions. In addition, they are never revised. This makes the Trader Edge recession model more responsive than many recession models. The current and historical data in this report reflect the current model configuration with all 26 variables.
Diffusion Index
The Trader Edge diffusion index equals the percentage of independent variables indicating a recession. With the latest changes, there are now a total of 26 explanatory variables, each with a unique look-back period and recession threshold. The resulting diffusion index and the trend in the diffusion index are two of the variables used to estimate the probit, logit, and neural network model forecasts.
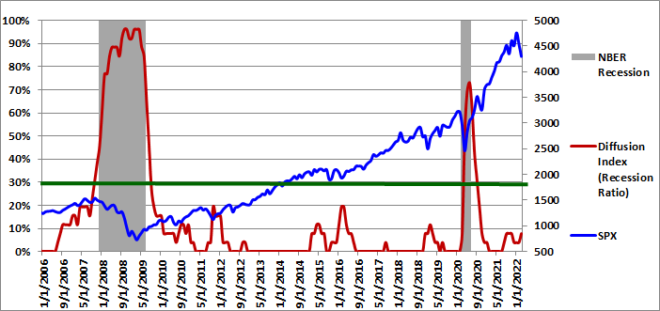
The graph of the diffusion index from 1/1/2006 to 03/1/2022 is presented in Figure 1 below (in red - left axis). The gray shaded regions in Figure 1 below represent U.S. recessions as defined (after the fact) by the National Bureau of Economic Research (NBER).
Despite the non-stop talk of recession, the number of explanatory variables indicating a recession was only two out of 26 (7.7%) in March 2022.
Please note that past estimates and index values will change whenever the historical data is revised and/or whenever model improvements are implemented. All current and past forecasts and index calculations are based on the most recent models using the latest revised data from the current data set.
0.5-Sigma Diffusion Index
The Trader Edge 0.5-sigma diffusion Index equals the percentage of explanatory variables with Z-scores that are less than 0.5 standard deviations above their respective recession thresholds. This new diffusion index is much more sensitive than the standard (zero-sigma) diffusion index. As a result, it provides much more detail on the health of the U.S. economy. The new 0.5-sigma diffusion index and the trend in the new diffusion index are two of the variables used to estimate the probit, logit, and neural network model forecasts.
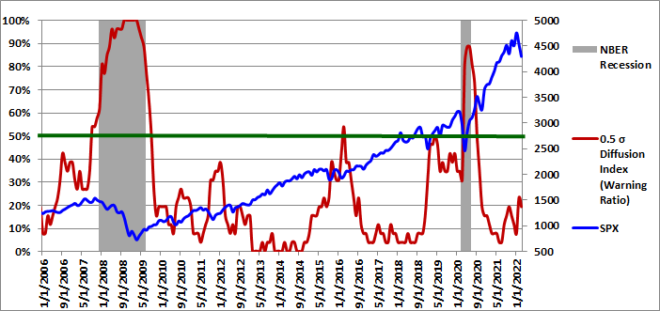
The graph of the 0.5-sigma diffusion index from 1/1/2006 to 03/1/2022 is presented in Figure 2 below (in red - left axis). The gray shaded regions in Figure 2 below represent U.S. recessions as defined (after the fact) by the National Bureau of Economic Research (NBER). The value of the S&P 500 index is also included (in blue - right axis).
The percentage of explanatory variables with Z-scores below the 0.5-sigma early warning threshold was only 19.2% in March, well below the early warning threshold of 50%. The additional level of detail provided by this more continuous and responsive metric is particularly valuable in the months leading up to or emerging from a recession, especially given the infrequent and more discrete movements of the standard (zero-sigma) diffusion index.
This new 0.5-sigma diffusion index and the trend in the new diffusion index are now both used directly in the neural network recession models. When combined with the recession slack indices, the new diffusion index provides even greater insight into rapidly changing conditions.
Recession Slack Indices
The Trader Edge recession slack index equals the median standardized deviation of the current value of the explanatory variables from their respective recession thresholds. The resulting value signifies the amount of slack or cushion relative to the recession threshold, expressed in terms of the number of standard deviations. Higher slack values signify larger cushions above recessionary threshold levels. While the median recession slack index is used in the recession models, I am now including the mean recession slack index in the graph as well. To mitigate the effect of extreme values (associated with extreme global economic events like COVID), the standardized deviation for each explanatory variable is capped before calculating the mean and median. I use both of these variables in the neural network models and in the probit and logit models.
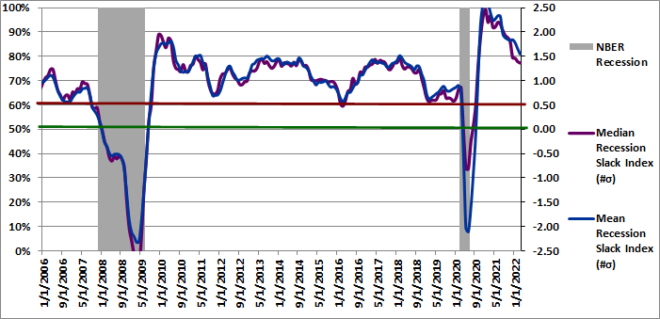
The gray shaded regions in Figure 3 below represent U.S. recessions as defined (after the fact) by the NBER. The median recession slack index is depicted in purple and is plotted against the right axis, which is expressed as the number of standard deviations above the recession threshold. The mean recession slack index is depicted in blue and is also plotted against the right axis.
The dark-red, horizontal line at 0.50 standard deviations denotes a possible warning threshold for the recession slack index. Many of the past recessions began when the recession slack index crossed below 0.50. Similarly, many of the past recessions ended when the recession slack index crossed back above 0.0.
In March 2022, the median recession slack index was +1.36 and the mean recession slack index (affected more by outliers - even when capped) was +1.56. While both slack indices are declining from the initial post COVID rapid growth spurt, they are still very high and are far above the early warning level of 0.50 sigma.
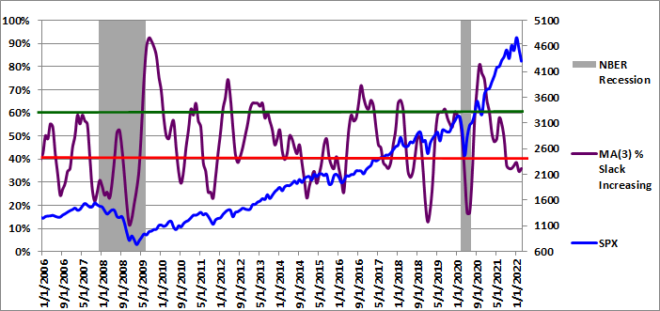
To gain further insight into the slack index, I provide the three-month moving average of the percentage of variables with increasing slack in Figure 4, but I personally monitor the monthly percentages as well.
Slack is a standardized value, so it is directly comparable across all variables. More slack indicates a larger cushion relative to a recessionary environment. As a result, we would like to see as many variables as possible with increasing slack. Given the diverse nature of the explanatory variables, it is unusual to see more than 60% of the variables with increasing slack or fewer than 40% of the variables with increasing slack. These extreme values are significant and usually predictive of the near-term direction of economic growth and often the equity market.
The 3-month moving average of the percentage of variables with increasing slack was only 35.9% in March. Normally, values below 40% would be cause for near-term concern. However, it is not realistic to expect the explosive growth following the initial COVID recovery period to continue indefinitely. If this trend decline in the slack indices continues after the slack indices fall to more normal levels (below 1.0 Sigma), that would be cause for concern. New evidence of economic weakness (or strength) often shows up first in this timely metric.
The ability to track small variations and trend changes over time illustrates the advantage of monitoring the continuous recession slack index. The new slack variable provides additional insight into the near-term direction of the economy and should be used in conjunction with the median recession slack index.
While it is useful to track the actual recession slack index values and percentage of variables with increasing slack, the diffusion percentages and slack index values are also used to generate the more intuitive probit and logit probability forecasts.
Aggregate Recession Probability Estimate
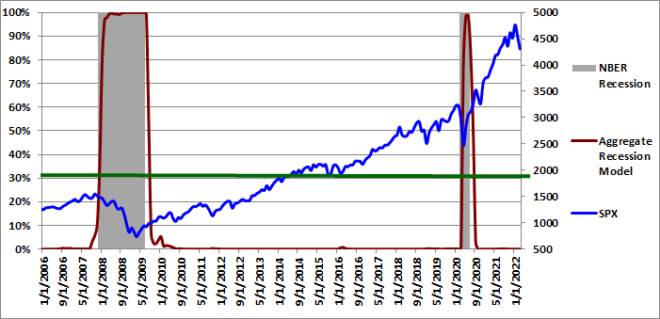
The Trader Edge aggregate recession model averages the estimates from probit and logit models derived from the level and trend in a subset of the four variables described above: the original diffusion index, the 0.5-sigma diffusion index, the slack indices, and the percentage of variables with increasing slack. The aggregate recession model estimates from 1/1/2006 to 03/01/2022 are depicted in Figure 5 below (red line - left vertical axis). The gray shaded regions represent NBER recessions and the blue line reflects the value of the S&P 500 index (right vertical axis). I suggest using a warning threshold of between 20-30% for the aggregate recession model (green horizontal line).
The aggregate recession model probability estimate remained at 0.0% in March 2022. The U.S. economy is not currently in a recession.
Aggregate Peak-Trough Probability Estimate
The peak-trough model forecasts are different from the recession model and are much more responsive. The peak-trough models estimate the probability of the S&P 500 being between the peak and trough associated with an NBER recession. The S&P 500 typically peaks before recessions begin and bottoms out before recessions end. As a result, it is far more difficult for the peak-trough model to fit this data and the model forecasts have larger errors than the recession model.
The Trader Edge aggregate peak-trough model is a weighted-average of the estimates from a number of different neural network models, all of which use the levels and trends of the diffusion and slack indices described above.
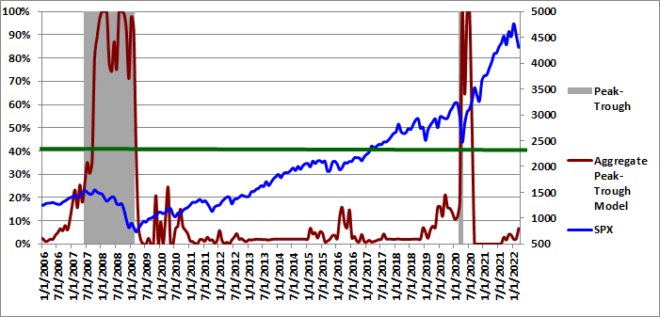
The aggregate peak-trough model estimates from 1/1/2006 to 03/01/2022 are depicted in Figure 6 below, which uses the same format as Figure 5, except that the shaded regions represent the periods between the peaks and troughs associated with NBER recessions. The value of the S&P 500 index is also included (in blue - right axis).
The aggregate peak-trough model probability estimate for 03/01/2022 was 6.7%, up from 2.2% in February.
Conclusion
The March diffusion indices, slack indices, and the recession model forecasts all indicate that the current U.S. recession risk is extremely low. The diffusion index is only two out of 26 (7.7%) and the 0.5 Sigma diffusion index is only 19.2%. The median and mean recession indices are +1.36 and +1.55 sigmas (respectively) above their recession thresholds, but they are declining. The moving average of explanatory variables with increasing slack is low (35.9%), but that is to be expected following the initial explosive rebound from COVID. The aggregate recession probability was still 0.0% and the peak-trough probability was only 6.7% in March.
While U.S. recession risk was very low as of March, there are many significant risks - and conditions could change rapidly. In addition, the cumulative effects of the war in Ukraine and the global sanctions against Russia will likely expand over time. This illustrates the value of developing and integrating robust, objective recession models in the investment process.
I continue to use the monthly Trader Edge recession model results to inform my own trading, hedging, and risk management decisions. However, due to time limitations, I will not be publishing the recession forecasts on a regular basis. However, if time permits and conditions warrant, I may post an occasional recession model update.
Unlike human prognosticators, the Trader Edge recession models are completely objective and have no ego. They are not burdened by the emotional need to defend past erroneous forecasts and will always consistently apply the insights gained from new data.
Brian Johnson
Copyright 2022 Trading Insights, LLC. All rights reserved.
AI Volatility Edge Platform: E-Subscription
Option Income Strategy (OIS) Universal Filter: E-Subscription


Hi Brian, with the increased recession talk and ongoing war, will you be publishing another update?