
I typically release new posts on Thursdays, but market conditions justified an accelerated schedule this week. Five independent leading indicators all point to near-term trouble for equities: a forming divergence in market breadth, an elevated CBOE Skew Index, a very low gamma-weighted Put/Call open interest ratio, an overvalued Price/Sales ratio and a plethora of overly bullish sentiment measures.
Market Breadth and the Advance-Decline Line
The cumulative advance-decline line is a running total of the number of advancing issues, less the number of declining issues for a specific list of securities. It is typically calculated on the NYSE, NASDAQ, and AMEX exchanges, but it can also be calculated on market indices. The advance-decline line is one of the many market breadth statistics, which are considered to be leading indicators and are widely used to identify major market turning points. If you would like to learn more about market breadth, please revisit one of my favorite articles "The Secret Weapon of Technical Analysis."
Market Breadth Divergence Forming
Bearish divergences occur when a price series reaches a new high and the predictive indicator does not. I recently wrote about the predictive power of double divergences in an article titled "The Deadly Double Divergence." While double divergences have been remarkably successful at calling market tops, single divergences should not be ignored. And there is one forming right now.
A bearish divergence occurs when the price series makes a higher high and the A-D line makes a lower high, but the highs in the price series and A-D line will not necessarily occur on the same date. The top panel in Figure 1 below is a daily candlestick chart of the S&P 500 index. The bottom panel is the cumulative advance-decline line for the combined NYSE, AMEX, and NASDAQ exchanges. Throughout the second half of 2013 the S&P 500 index and the cumulative advance-decline line made a series of higher highs, except in early August.
In early August, the S&P 500 made another higher high, but the cumulative advance-decline line made a lower high, signaling a bearish divergence. The lack of breadth participating in the July 2013 rally provided a timely indication of a short-term market top. As you can see from the chart below, the S&P 500 declined significantly during the month of August.
A similar chart pattern is forming now. As of Friday's close, the S&P 500 made another higher high, but the cumulative advance-decline line was still well below its prior high. However, the bearish divergence pattern is not yet complete. The cumulative advance-decline line is still increasing. If it continues to increase and peaks above its previous high (without a significant pullback), then this pattern would not be a bearish divergence.
If the cumulative advance-decline line begins to decline before exceeding its prior peak, then the bearish divergence pattern would be complete.
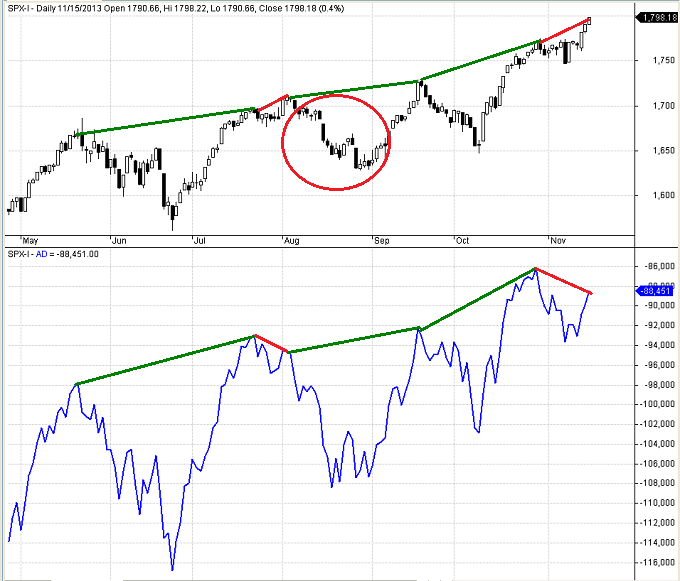
Figure 1: Forming Divergence 11-15-2013
The CBOE SKEW Index
According to the CBOE,
The CBOE SKEW Index ("SKEW") is an index derived from the price of S&P 500 tail risk. Similar to VIX®, the price of S&P 500 tail risk is calculated from the prices of S&P 500 out-of-the-money options. SKEW typically ranges from 100 to 150. A SKEW value of 100 means that the perceived distribution of S&P 500 log-returns is normal, and the probability of outlier returns is therefore negligible. As SKEW rises above 100, the left tail of the S&P 500 distribution acquires more weight, and the probabilities of outlier returns become more significant. As SKEW rises above 100, the left tail of the S&P 500 distribution acquires more weight, and the probabilities of outlier returns become more significant. One can estimate these probabilities from the value of SKEW.
The SKEW index is not nearly as well known or widely used as the VIX index, but it is a very useful indicator of unstable markets that are prone to significant downside corrections. When the SKEW becomes elevated, the market-implied probability of a large adverse price move increases significantly.
The Top panel in Figure 2 below is a weekly candlestick chart of the S&P 500 index for the last four years. The blue line in the bottom panel is the CBOE SKEW Index. The horizontal red line depicts a somewhat arbitrary SKEW Index warning level of 130. There were only seven periods when the SKEW index exceeded 130 during the past four years. The period in early 2013 resulted in a brief consolidation. In every other case, the S&P 500 Index suffered a painful multi-week pullback. The CBOE SKEW Index was 133.46 as of last Friday (11/15/2013) and has been elevated for several weeks. The SKEW index strongly suggests trouble ahead for the equity market.
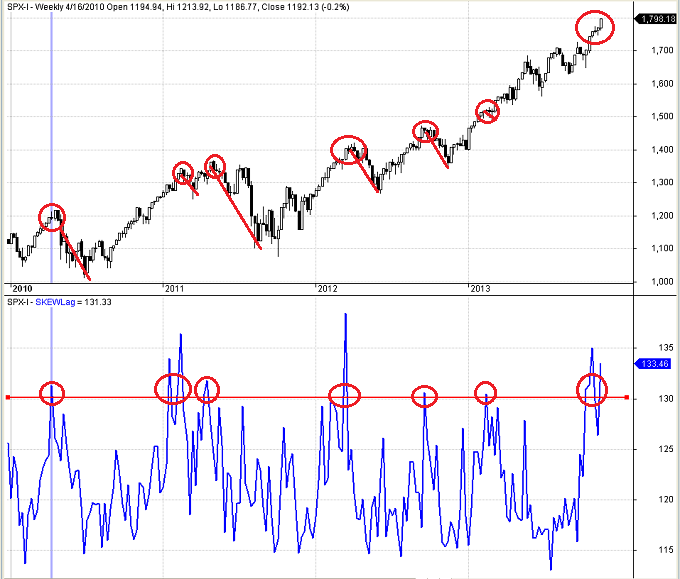
Figure 2: CBOE SKEW Index 11-15-2013
Shaeffer's Gamma-Weighted SOIR
The ratio of open interest in puts to calls in the SPY ETF has also proven to be a reliable indicator of overbought or oversold conditions in the equity market. Shaeffer's Gamma-Weighted SOIR goes a step further than a standard put/call ratio and uses the gamma of each option to assign weights to the put and call open interest values for each option. This increases the relative importance of the open interest of at-the-money options. When the SOIR is low (below 0.90), the market is excessively bullish and the risk of a pullback is elevated.
The red line in Figure 3 below represents the closing price of the SPDR S&P 500 ETF (SPY) for the last 6 months. The blue line in Figure 3 is Schaeffer's gamma-weighted SOIR. As of 11/14/2013, the SOIR was 0.79. The SOIR dropped below 0.90 three other times in the past six months. The first two instances led to rapid pullbacks. The market consolidated for two weeks after the most recent occurrence. The very low SOIR suggests a near-term reversal.
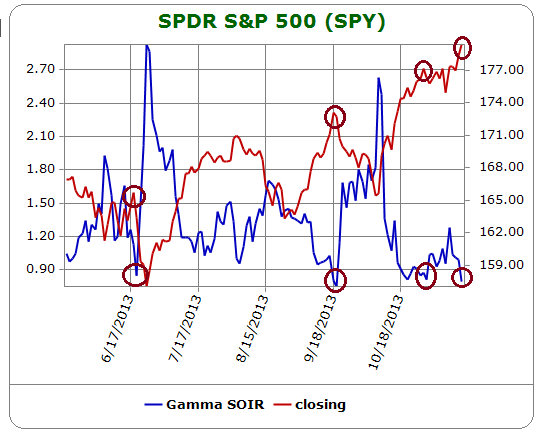
Figure 3: Gamma-weighted SOIR 11-15-2013
Price-to-Sales Ratio
In May of 2013 I posted an article on the overvalued price-to-sales ratio (PSR) of the S&P 500 index titled S&P 500 overvalued based on Price-to-Sales ratio. At the time, the price-to-sales ratio of the S&P 500 was 1.53, which was approaching historical highs. The chart in Figure 4 below represents the price-to-sales ratio for the S&P 500 index. It is one of the many economic and market-related data series available at Multpl.com. The PSR for the S&P 500 increased from 1.53 in May to 1.63 as of 11/15/2013. The PSR has not been this overvalued since the height of the tech bubble in 2000. Coupled with the technical warning signs above, this is especially troubling.
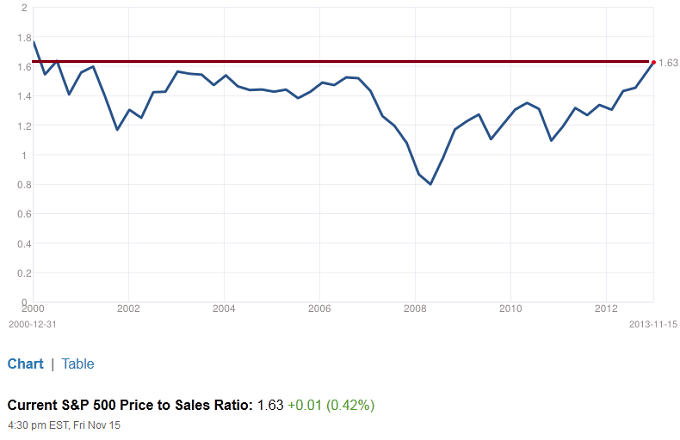
Figure 4: S&P 500 Price-to-Sales Ratio 11-15-2013
Market Sentiment
There are many different market sentiment indicators, most of which are contrarian indicators. In other words, when the entire world is bullish, there is nobody left to buy and a market decline must be imminent. I subscribe to Sentiment Trader, which aggregates, publishes, and analyzes an exhaustive list of sentiment indicators. In addition, it is also possible for subscribers to download the historical data for many of their data series. As a result, I aggregated several of their data series into a custom sentiment index, which I use directly in my systematic strategies.
Unfortunately, their data is not available without a subscription and I am not authorized to republish their charts or data. Consequently, I can only say that the market sentiment data that I follow strongly supports a near-term pullback in the equity market.
Conclusion
Attempting to call market tops is not conducive to long-term trading success. Then again, neither is ignoring strong signals from multiple independent indicators, each with an impressive predictive history. Not only is the equity market overvalued, it is also overbought and market sentiment is excessively bullish.
According to the most recent recession model forecast, the probability of a recession in the near term is extremely remote. Nevertheless, market pullbacks can occur in any economic environment. If you trade systematically, you should have significant gains in most of your equity positions. It might be prudent to hedge a portion of your bullish exposure and protect some of those hard-earned gains.
If the market does correct and recession risk is still benign, that would create an excellent buying opportunity.
Trader Edge Strategy E-Subscription Available: 20% ROR
The Trader Edge Asset Allocation Rotational (AAR) Strategy is a conservative, long-only, asset allocation strategy that rotates monthly among five large asset classes. The AAR strategy has generated 20%+ annual returns over the combined back and forward test period. Please use the above link to learn more about the AAR strategy.
Feedback
Your comments, feedback, and questions are always welcome and appreciated. Please use the comment section at the bottom of this page or send me an email.
Referrals
If you found the information on www.TraderEdge.Net helpful, please pass along the link to your friends and colleagues or share the link with your social or professional networks.
The "Share / Save" button below contains links to all major social and professional networks. If you do not see your network listed, use the down-arrow to access the entire list of networking sites.
Thank you for your support.
Brian Johnson


FTSE appears to be showing all the signs of a market topping out, Looking at http://WWW.FTSEFOREX.COM also we see that other world markets and Forex pairs are not yet confirming this. The time of the year tends to see rising market through low trading volume over the month of December, time will tell.
Graham,
It is very difficult to call market tops, especially when the seasonal pattern is still bullish. Nevertheless, the bearish headwinds are still in place.
Thanks for following Trader Edge.
Brian Johnson