
Coronavirus Implications
Before proceeding with the model results this month, I need to explain how and when the coronavirus (COVID-19) will affect the recession model forecasts. The coronavirus is an unprecedented, discrete, exogenous event that will severely affect the global economy and has already roiled the financial markets. While quantitative models like the recession models are invaluable, they are unable to model unique external events, especially one of this speed, breadth, and magnitude. Even under normal circumstances, integrating judgement with quantitative analysis is essential; in this case, it is even more critical.
While the World Health Organization (WHO) was the last to know, COVID-19 is a global pandemic. According to experts, there are only two ways to slow the spread of the virus: widespread quarantine and restricting travel and social interaction (China), or widespread testing and selective quarantine / intervention (South Korea). Unfortunately, few countries took these early steps, and the growth rates have exploded. In a single day (March 13th to March 14th), the number of new cases increased by over 10% in 54 different countries and by over 20% in 38 different countries.
In other countries (such as the U.S.) delayed testing suggests that cases are significantly underreported, which has slowed containment efforts. Some countries may be intentionally underreporting the spread of disease for political purposes. COVID-19 is particularly difficult to contain because it apparently can be spread by individuals who are asymptomatic.
Given the limited number of hospital beds, health care professionals, respirators, etc., the only viable plan appears to be to slow the spread of the disease as much as possible to avoid overburdening the limited health care resources and buy additional time for the development of a vaccine. There is also some hope that warmer weather could help contain the virus.
To buy more time, unprecedented steps have already been implemented in various locations across the globe to enforce social distancing and limit human interaction: suspension of cruise ship travel, suspension of air traffic between the U.S. and Europe, suspension of NBA, NHL, and NCAA sports seasons, immediate shift of University classes to online, closing K-12 schools, movie theaters, restaurants, and all indoor gatherings of more than a given number of people, etc.
While these steps are necessary, they will all have serious economic consequences. Corporate revenues have already dropped and will continue to fall further as these steps become more widespread. Unfortunately, many corporate costs are fixed, which means that the effects on corporate earnings will be even more pronounced. Even more serious, many corporations have taken advantage of 10+ years of very low interest rates by greatly expanding their use of debt. This financial engineering inflated earnings (and stock values) when times were good, but many of these companies would be unable to cover their interest payments if this situation persists. This would lead to corporate defaults, job losses, a self-reinforcing downward spiral, and a global recession.
Finally, a 25% decline in equity markets in a little over a month will probably result in a wealth effect, further dampening economic growth. The coronavirus and the market meltdown are the lead stories on every news site and broadcast. This reduces consumer and business confidence, increases uncertainty and risk premiums, which reduces spending and investment, which reduces GDP and corporate earnings, which leads to more layoffs and further market declines.
The economic impact of the containment efforts is real. “Buying the dip” is a popular and effective strategy in a healthy and growing economy, but not in the early stages of a recession. Hypothetically, if stock prices declined by 25% and earnings declined by 50%, equities would not be cheaper; they would be twice as expensive.
Several economists have increased their probability estimates of a U.S. recession to 75% in the next six months. Unless the coronavirus is contained in the very near future (eliminating the need for global containment measures), that probability estimate may be too low; a U.S. and global recession would probably be unavoidable. As you will see in the recession model update below, the effects of the coronavirus are not yet evident in the model forecast – and will not be fully captured in the explanatory variables for a number of months.
Furthermore, in a typical recession scenario, several of the economic variables usually lead the market and the overall trend in economy by many months, but that does not happen if the recession is triggered by a large exogenous shock. The unusual immediate reversal of the economic and market trends also limits the effectiveness of the market-sensitive explanatory variables, several of which typically have long lead times.
In the case of the coronavirus, the recession model forecasts can be used to confirm and quantify the impact on the economy, but only with a lag. However, if we do enter a recession and eventually contain the coronavirus, the recession model should be useful in evaluating the probable end of the recession. If containment efforts, warmer temperatures, and/or a vaccine are immediately effective in containing the virus, the recession model would also be useful in quantifying the magnitude of the near-term economic impact and the speed of the recovery. Integration of qualitative factors outside the model will continue to be critically important in the investment process.
Monthly Update
I made a number of significant improvements to the recession model in January of 2020. If you missed the January recession model post, or if you would like to review the improvements to the models, please revisit the Recession Model Forecast: 01-01-2020.
This article updates the diffusion indices, recession slack index, aggregate recession model, and aggregate peak-trough model through February 2020. The current 26-variable model has a diverse set of explanatory variables and is quite robust. Each of the explanatory variables has predictive power individually; when combined, the group of indicators is able to identify early recession warnings from a wide range of diverse market-based, fundamental, technical, and economic sources.
Several of the explanatory variables are market-based. These variables are available in real-time (no lag), which means they respond very quickly to changing market conditions. In addition, they are never revised. This makes the Trader Edge recession model more responsive than many recession models. The current and historical data in this report reflect the current model configuration with all 26 variables.
Diffusion Index
The Trader Edge diffusion index equals the percentage of independent variables indicating a recession. With the latest changes, there are now a total of 26 explanatory variables, each with a unique look-back period and recession threshold. The resulting diffusion index and the trend in the diffusion index are two of the variables used to estimate the probit, logit, and neural network model forecasts.
The graph of the diffusion index from 1/1/2006 to 3/1/2020 is presented in Figure 1 below (in red - left axis). The gray shaded regions in Figure 1 below represent U.S. recessions as defined (after the fact) by the National Bureau of Economic Research (NBER). The value of the S&P 500 index is also included (in blue - right axis).
The U.S. economy flirted with entering a recession in early 2016, which was reflected in the deteriorating economic, fundamental, and especially market-based data. The diffusion index, slack index, and recession probability forecasts all captured the weakening conditions. However, the weakness proved to be temporary and the conditions and recession model forecasts improved rapidly.
Preliminary signs of weakness reemerged in late 2018 and conditions deteriorated rapidly in December and January before rebounding in February through April of 2019 and stabilizing thereafter. Upon detailed examination of the individual economic data series, it is clear that the Government shutdown temporarily affected the economic data. The most recent economic data is no longer affected, but the shutdown did temporarily affect the look-back data and the resulting trends. I initially went back and smoothed the trend data for every economic variable, but the new trend calculation is even more effective at reducing the impact of outliers, which makes it more robust. Smoothing the look-back data mitigates the impact of all such data outliers now and in the future. The number of explanatory variables indicating a recession remained at zero (0.0%) in February.
As explained above, it will take a number of months before the long-term effects of the coronavirus are fully reflected in the trends of the explanatory variables.
Please note that past estimates and index values will change whenever the historical data is revised and/or whenever model improvements are implemented. All current and past forecasts and index calculations are based on the most recent models using the latest revised data from the current data set.
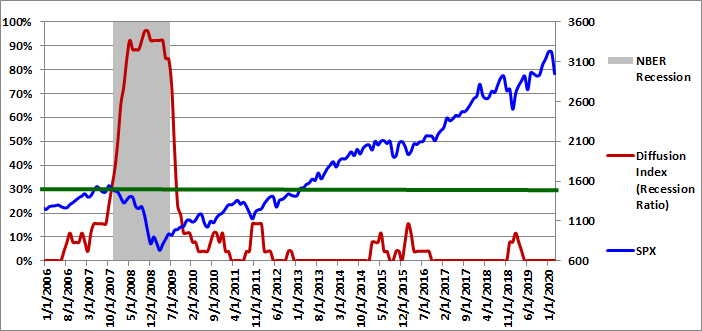
Figure 1: Diffusion Index 03-01-2020
0.5-Sigma Diffusion Index
The Trader Edge 0.5-sigma diffusion Index equals the percentage of explanatory variables with Z-scores that are less than 0.5 standard deviations above their respective recession thresholds. This new diffusion index is much more sensitive than the standard (zero-sigma) diffusion index. As a result, it provides much more detail on the health of the U.S. economy. The new 0.5-sigma diffusion index and the trend in the new diffusion index are two of the variables used to estimate the probit, logit, and neural network model forecasts.
The graph of the 0.5-sigma diffusion index from 1/1/2006 to 3/1/2020 is presented in Figure 2 below (in red - left axis). The gray shaded regions in Figure 2 below represent U.S. recessions as defined (after the fact) by the National Bureau of Economic Research (NBER). The value of the S&P 500 index is also included (in blue - right axis).
The percentage of explanatory variables with Z-scores below the 0.5-sigma early warning threshold increased from 30.8% to 34.6% in February. The additional level of detail provided by this more continuous and responsive metric will be invaluable going forward, especially given the infrequent and more discrete movements of the standard (zero-sigma) diffusion index.
As I noted in past months, the percentage of variables with Z-scores below their respective 0.5 sigma thresholds is unusually high, especially with the standard diffusion index equal to zero. I used the entire history to calculate the average 0.5-sigma diffusion index percentage when the zero-sigma diffusion index was zero. The resulting average was only 8.1% - compared to 34.6% at the end of February.
In other words, the percentage of explanatory variables with Z-scores that are within 0.5 sigma of their respective recession thresholds is currently over four times the historical average. This increased vulnerability could significantly accelerate the economic decline if the coronavirus continues to spread.
This new 0.5-sigma diffusion index and the trend in the new diffusion index are now both used directly in the new recession models. When combined with the recession slack indices, the new diffusion index provides even greater insight into rapidly changing conditions.
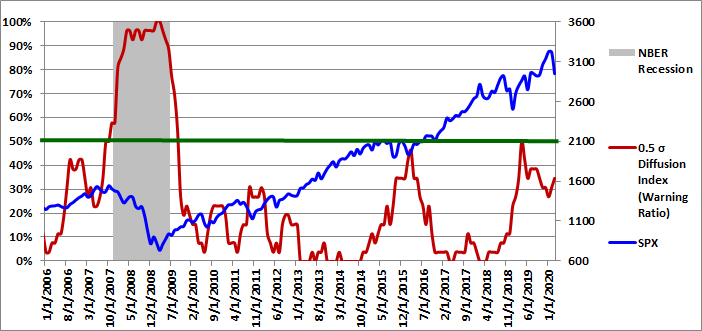
Figure 2: 0.5 Sigma Diffusion Index 03-01-2020
Recession Slack Index
The Trader Edge recession slack index equals the median standardized deviation of the current value of the explanatory variables from their respective recession thresholds. The resulting value signifies the amount of slack or cushion relative to the recession threshold, expressed in terms of the number of standard deviations. Higher slack values signify larger cushions above recessionary threshold levels. While the median recession slack index is used in the recession models, I am now including the mean recession slack index in the graph as well.
The gray shaded regions in Figure 3 below represent U.S. recessions as defined (after the fact) by the NBER. The median recession slack index is depicted in purple and is plotted against the right axis, which is expressed as the number of standard deviations above the recession threshold. The mean recession slack index is depicted in blue and is also plotted against the right axis.
The dark-red, horizontal line at 0.50 standard deviations denotes a possible warning threshold for the recession slack index. Many of the past recessions began when the recession slack index crossed below 0.50. Similarly, many of the past recessions ended when the recession slack index crossed back above 0.0.
In February 2020, the median recession slack index decreased from 0.80 to 0.76. The mean recession slack index declined from 0.91 to 0.81. The mean and median slack indices remain relatively close to the 0.5-sigma early warning threshold. This is consistent with the fact that a surprising 34.6% of the explanatory variables are below the 0.5-sigma threshold.
Similar to the situation with the 0.5-sigma diffusion index, the median slack index is unusually low, especially with the standard diffusion index equal to zero. I used the entire history to calculate the average median slack index when the zero-sigma diffusion index was zero. The resulting average was 1.39 standard deviations above the recession threshold - compared to a median slack index of only 0.76 standard deviations at the end of February.
In other words, median slack index is only 0.26 above the early warning threshold - compared to a typical spread of 0.89 standard derivations. As a result, the cushion above the 0.5-sigma early warning threshold is a fraction of its typical value when the diffusion index equals zero.
The slack indices and the trend in the slack indices are now both used directly in the latest recession models. Note, all of these values reflect the new smoothed trend data. The mean and median slack indices would both be expected to decline as the effects of the coronavirus become more evident in the coming months.
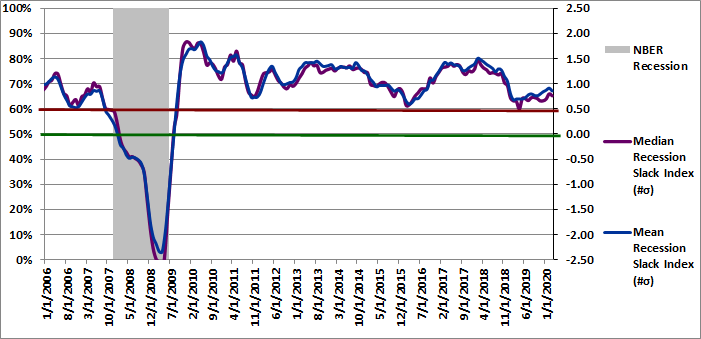
Figure 3: Recession Slack Index 03-01-2020
To gain further insight into the slack index, I provide the three-month moving average of the percentage of variables with increasing slack in Figure 4, but I personally monitor the monthly percentages as well. The moving average of the percentage of variables with increasing slack and the trend in that moving average are two of the variables used to estimate the probit, logit, and neural network model forecasts.
Slack is a standardized value, so it is directly comparable across all variables. More slack indicates a larger cushion relative to a recessionary environment. As a result, we would like to see as many variables as possible with increasing slack. Given the diverse nature of the explanatory variables, it is unusual to see more than 60% of the variables with increasing slack or fewer than 40% of the variables with increasing slack. These extreme values are significant and predictive of the near-term direction of economic growth and often the equity market.
The 3-month moving average of the percentage of variables with increasing slack decreased sharply from 60.3% to 48.7% in February. The percentage of variables with increasing slack was only 34.6% in February. New evidence of economic weakness (or strength) often shows up first in this timely metric. The sharp decline in February is the first glimpse of the eventual effects of the coronavirus.
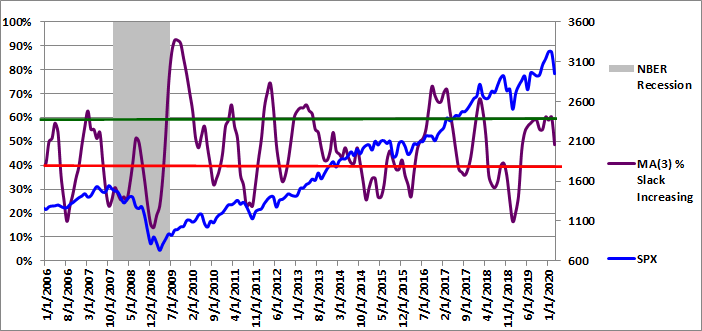
Figure 4: MA(3) % Slack Increasing 03-01-2020
The ability to track small variations and trend changes over time illustrates the advantage of monitoring the continuous recession slack index. The new slack variable provides additional insight into the near-term direction of the economy and should be used in conjunction with the median recession slack index.
While it is useful to track the actual recession slack index values and percentage of variables with increasing slack, the diffusion percentages and slack index values are also used to generate the more intuitive probit and logit probability forecasts.
Aggregate Recession Probability Estimate
The Trader Edge aggregate recession model averages the estimates from probit and logit models derived from the level and trend in a subset of the four variables described above: the original diffusion index, the 0.5-sigma diffusion index, the slack indices, and the percentage of variables with increasing slack. The aggregate recession model estimates from 1/1/2006 to 3/01/2020 are depicted in Figure 5 below (red line - left vertical axis). The gray shaded regions represent NBER recessions and the blue line reflects the value of the S&P 500 index (right vertical axis). I suggest using a warning threshold of between 20-30% for the aggregate recession model (green horizontal line).
The aggregate recession model probability estimate increased from 0.0% to 0.1% in February. Normally, that would indicate that the probability that the U.S. is currently in a recession is extremely remote. However, as explained above, that is not the case given the unprecedented exogenous shock of the coronavirus, which is not yet evident in the data.
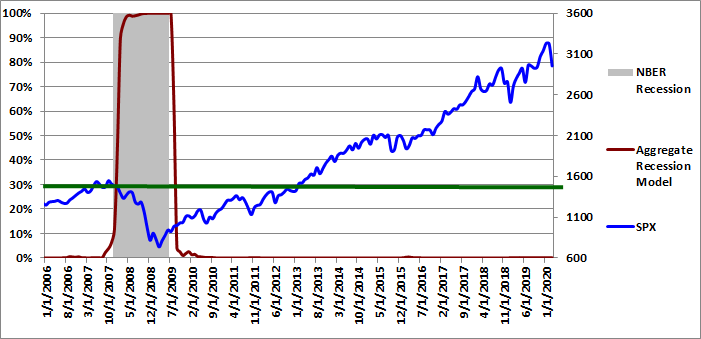
Figure 5: Aggregate Recession Model 03-01-2020
Aggregate Peak-Trough Probability Estimate
The peak-trough model forecasts are different from the recession model and are much more responsive. The peak-trough models estimate the probability of the S&P 500 being between the peak and trough associated with an NBER recession. The S&P 500 typically peaks before recessions begin and bottoms out before recessions end. As a result, it is far more difficult for the peak-trough model to fit this data and the model forecasts have larger errors than the recession model.
The Trader Edge aggregate peak-trough model is a weighted-average of the estimates from a number of different neural network models, all of which use the levels and trends of the four variables described above: the original diffusion index, the 0.5-sigma diffusion index, the slack indices, and the percentage of variables with increasing slack.
The aggregate peak-trough model estimates from 1/1/2006 to 3/01/2020 are depicted in Figure 6 below, which uses the same format as Figure 5, except that the shaded regions represent the periods between the peaks and troughs associated with NBER recessions.
The aggregate peak-trough model probability estimate for 3/01/2020 was 0.8%, which decreased by 0.3% from last month's revised value of 1.1%. As explained above, this probability estimate does not reflect the effects of the coronavirus.
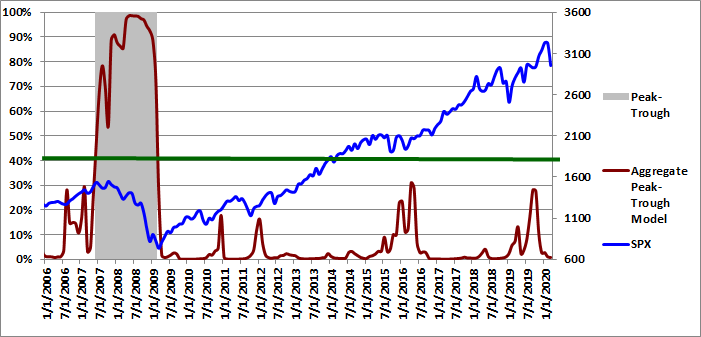
Figure 6: Aggregate Peak-Trough Model 03-01-2020
Conclusion
Despite the persistent low slack index values, the recession model probability estimates of a U.S. recession have remained quite low, but the effects of the coronavirus are not yet evident in the model forecast – and will not be fully captured in the explanatory variables for a number of months. With that caveat, the diffusion index has remained at zero (0.0%) since the end of April 2019. The new 0.5-sigma diffusion index increased from 30.8% to 34.6% in February. The mean and median recession slack indices both decreased slightly this month; the slack indices remain close to the 0.5-sigma early warning threshold and both are now decreasing. The moving average of explanatory variables with increasing slack dropped sharply from 60.3% to 48.7% in February. The aggregate recession probability increased from 0.0% to 0.1%. The peak-trough recession probability decreased from 1.1% to 0.8%. Again, these probability estimates do not include the effects of the coronavirus.
Even with the low recession model probabilities, there is has been lingering concern with the relatively low recession slack index values and the elevated 0.5-sigma diffusion index, especially given the uncertainty associated with the ongoing trade war, the coronavirus, and the November election. This increased vulnerability is particularly problematic now that the coronavirus has become a global pandemic.
Based on the most recent data, the equity allocation percentage regression model indicates that the expected annual price return of the S&P 500 index for the next 10 years is still negative (-0.7%), with an expected drawdown in that period of 36% (from 3/1/2020 levels). Expected price returns are still extremely low in a historical context, especially given the near-term market, economic, and geopolitical risks.
The "Buffett Indicator" regression model currently indicates that the expected annual price return of the S&P 500 index for the next 10 years is materially negative (-6.5%), with an expected drawdown in that 10-year period of 59% (from 3/1/2020 levels).
History offers compelling evidence that bullish equity positions today will face significant headwinds over the coming years.
Unlike human prognosticators, the Trader Edge recession models are completely objective and have no ego. They are not burdened by the emotional need to defend past erroneous forecasts and will always consistently apply the insights gained from new data.
Brian Johnson
Copyright 2020 Trading Insights, LLC. All rights reserved.


Pingback: New Coronavirus Model and the Economy | Trader Edge