
Before I update the recession forecast, I want to share some new developments. First, I have decided not to return to teach in the MBA program at Carolina next year. I had hoped that teaching part-time would still allow me to continue all of my research and proprietary trading efforts, but that has not proven to be the case. While it is personally rewarding to work with the students, the opportunity cost of teaching is currently too high.
After completing my MBA derivatives class in December, I devoted the last six weeks to implementing new improvements to the recession models and to setting up a new high-powered Windows 10 laptop to replace my two Windows 7 desktop computers. Due to compatibility issues with Windows 10, this required new neural network software, which I use to make recession forecasts.
I began designing neural networks over 20 years ago, but I do not create new neural network models on a regular basis. As a result, I took this opportunity to get up to speed on the latest developments in AI, particularly deep learning and the corresponding new types of network layers, activation functions, and optimization algorithms. I also took two online classes and experimented with several different software packages. After researching AI platforms, I purchased one AI software suite and am also using a separate deep learning package that is currently available for free (and integrates with Python).
I have made several important improvements to the recession forecasting models. Over the past several years, I added a number of new explanatory variables and dropped a few others. As a result, I did not need to add any new variables at this time. However, I did implement a new approach to quantifying the trend in every explanatory variable. This approach smooths the trend calculation, which further reduces the impact of data outliers – an issue I discussed after the most recent Government shutdown. It also makes all of the trend calculations more robust by reducing the potential for over-fitting.
The original peak-trough neural network models were derived from the initial diffusion index. All of the new models are based on four explanatory variables: the original diffusion index, the 0.5 sigma diffusion index, the median recession slack index, and a moving average of the percentage of explanatory variables with increasing slack. I have discussed each of these metrics in past recession model reports. In addition to the latest values for each of these variables, the trends in these four variables (using the same approach used for the individual variables) are also input into the models. This results in a maximum of eight variables used in the new neural network peak-trough models.
Due to the complexity of the problem, I used neural network models exclusively to build the peak-trough models. As is always advisable with neural networks, I aggregate the results from a number of different neural network models to arrive at the peak-trough forecast. Each neural network has a different architecture, training set, activation function, or optimization algorithm, etc. In addition, I went to great pains to prevent the neural network models from over-fitting the data, including withholding validation and testing data sets and limiting the size of the network.
I also re-estimated the probit and logit functions (from a subset of the eight variables used as inputs for the neural networks) for the standard recession model (which forecasts the probability the U.S. economy is currently in a recession). This is a much easier problem than the peak-trough estimation. As a result, neural networks are not required for the standard recession model. The probit and logit functions were sufficiently powerful.
I am excited about the recession model improvements, which combine all of the new metrics I have implemented over the past few years, plus a number of new cutting-edge tools and techniques. All of the current and historical forecasts presented going forward will be based on the new models.
December Update
This article updates the diffusion indices, recession slack index, aggregate recession model, and aggregate peak-trough model through December 2019. The current 26-variable model has a diverse set of explanatory variables and is quite robust. Each of the explanatory variables has predictive power individually; when combined, the group of indicators is able to identify early recession warnings from a wide range of diverse market-based, fundamental, technical, and economic sources.
Several of the explanatory variables are market-based. These variables are available in real-time (no lag), which means they respond very quickly to changing market conditions. In addition, they are never revised. This makes the Trader Edge recession model more responsive than many recession models. The current and historical data in this report reflect the current model configuration with all 26 variables.
Diffusion Index
The Trader Edge diffusion index equals the percentage of independent variables indicating a recession. With the latest changes, there are now a total of 26 explanatory variables, each with a unique look-back period and recession threshold. The resulting diffusion index and the trend in the diffusion index are two of the variables used to estimate the probit, logit, and neural network model forecasts.
The graph of the diffusion index from 1/1/2006 to 1/1/2020 is presented in Figure 1 below (in red - left axis). The gray shaded regions in Figure 1 below represent U.S. recessions as defined (after the fact) by the National Bureau of Economic Research (NBER). The value of the S&P 500 index is also included (in blue - right axis).
The U.S. economy flirted with entering a recession in early 2016, which was reflected in the deteriorating economic, fundamental, and especially market-based data. The diffusion index, slack index, and recession probability forecasts all captured the weakening conditions. However, the weakness proved to be temporary and the conditions and recession model forecasts improved rapidly.
Preliminary signs of weakness reemerged in late 2018 and conditions deteriorated rapidly in December and January before rebounding in February through April and stabilizing thereafter. Upon detailed examination of the individual economic data series, it is clear that the Government shutdown temporarily affected the economic data. The most recent economic data is no longer affected, but the shutdown did temporarily affect the look-back data and the resulting trends. I initially went back and smoothed the trend data for every economic variable, but the new trend calculation is even more effective at reducing the impact of outliers, which makes it more robust. Smoothing the look-back data mitigates the impact of all such data outliers now and in the future. The number of explanatory variables indicating a recession remained at zero (0.0%) in December.
Please note that past estimates and index values will change whenever the historical data is revised and/or whenever model improvements are implemented. All current and past forecasts and index calculations are based on the most recent models using the latest revised data from the current data set.
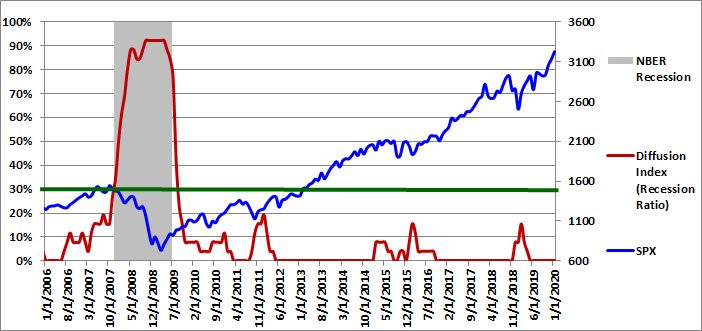
Figure 1: Diffusion Index 01-01-2020
0.5-Sigma Diffusion Index
The Trader Edge 0.5-sigma diffusion Index equals the percentage of explanatory variables with Z-scores that are less than 0.5 standard deviations above their respective recession thresholds. This new diffusion index is much more sensitive than the standard (zero-sigma) diffusion index. As a result, it provides much more detail on the health of the U.S. economy. The new 0.5-sigma diffusion index and the trend in the new diffusion index are two of the variables used to estimate the probit, logit, and neural network model forecasts.
The graph of the 0.5-sigma diffusion index from 1/1/2006 to 1/1/2020 is presented in Figure 2 below (in red - left axis). The gray shaded regions in Figure 2 below represent U.S. recessions as defined (after the fact) by the National Bureau of Economic Research (NBER). The value of the S&P 500 index is also included (in blue - right axis).
The percentage of explanatory variables with Z-scores below the 0.5-sigma early warning threshold increased from 30.8% to 34.6% in December. The additional level of detail provided by this more continuous and responsive metric will be invaluable going forward, especially given the infrequent and more discrete movements of the standard (zero-sigma) diffusion index.
As I noted in past months, the percentage of variables with Z-scores below their respective 0.5 sigma thresholds is unusually high, especially with the standard diffusion index equal to zero. I used the entire history to calculate the average 0.5-sigma diffusion index percentage when the zero-sigma diffusion index was zero. The resulting average was only 8.1% - compared to 34.6% at the end of December.
In other words, the percentage of explanatory variables with Z-scores that are within 0.5 sigma of their respective recession thresholds is currently over four times the historical average. This new 0.5-sigma diffusion index and the trend in the new diffusion index are now both used directly in the new recession models.
When combined with the recession slack indices, the new diffusion index provides even greater insight into rapidly changing conditions.
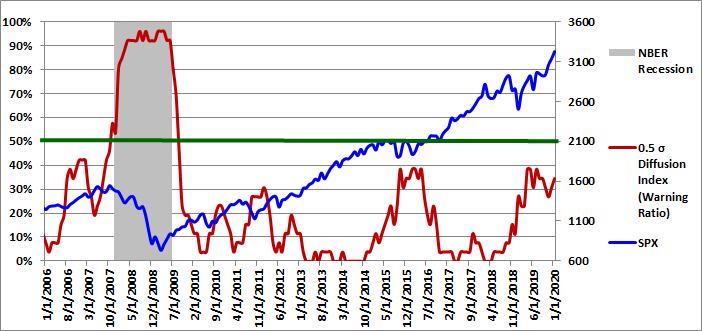
Figure 2: 0.5 Sigma Diffusion Index 01-01-2020
Recession Slack Index
The Trader Edge recession slack index equals the median standardized deviation of the current value of the explanatory variables from their respective recession thresholds. The resulting value signifies the amount of slack or cushion relative to the recession threshold, expressed in terms of the number of standard deviations. Higher slack values signify larger cushions above recessionary threshold levels. While the median recession slack index is used in the recession models, I am now including the mean recession slack index in the graph as well.
The gray shaded regions in Figure 3 below represent U.S. recessions as defined (after the fact) by the NBER. The median recession slack index is depicted in purple and is plotted against the right axis, which is expressed as the number of standard deviations above the recession threshold. The mean recession slack index is depicted in blue and is also plotted against the right axis.
The dark-red, horizontal line at 0.50 standard deviations denotes a possible warning threshold for the recession slack index. Many of the past recessions began when the recession slack index crossed below 0.50. Similarly, many of the past recessions ended when the recession slack index crossed back above 0.0.
In early-2014, the revised median recession slack index peaked at 1.42, far above the warning level of 0.50. The recession slack index declined significantly in 2015 and reached a low of 0.59 in March 2016, before rebounding over the next few months. For most of 2017 and 2018, the median recession slack index was quite strong, but declined sharply in the fall of 2018. In 2019, the median recession slack index continued to decline, reaching a low of 0.64 at the end of November.
In December 2019, the median recession slack index increased from 0.64 to 0.75. The mean recession slack index increased from 0.85 to 0.86. As I mentioned above, the mean and median slack indices remain relatively close to the 0.5-sigma early warning threshold. This is consistent with the fact that a surprising 34.6% of the explanatory variables are below the 0.5-sigma threshold.
Similar to the situation with the 0.5-sigma diffusion index, the median slack index is unusually low, especially with the standard diffusion index equal to zero. I used the entire history to calculate the average median slack index when the zero-sigma diffusion index was zero. The resulting average was 1.39 standard deviations above the recession threshold - compared to a median slack index of only 0.75 standard deviations at the end of December.
In other words, median slack index is only 0.25 above the early warning threshold - compared to a typical spread of 0.89 standard derivations. As a result, the cushion above the 0.5-sigma early warning threshold is a fraction of its typical value when the diffusion index equals zero. On a positive note, the short-term trend in the recession slack indices is favorable.
The slack indices and the trend in the slack indices are now both used directly in the latest recession models. Note, all of these values reflect the new smoothed trend data.
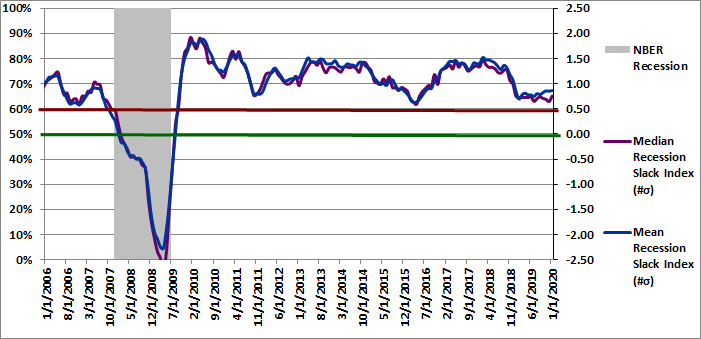
Figure 3: Recession Slack Index 01-01-2020
To gain further insight into the slack index, I provide the three-month moving average of the percentage of variables with increasing slack in Figure 4, but I personally monitor the monthly percentages as well. The moving average of the percentage of variables with increasing slack and the trend in that moving average are two of the variables used to estimate the probit, logit, and neural network model forecasts.
Slack is a standardized value, so it is directly comparable across all variables. More slack indicates a larger cushion relative to a recessionary environment. As a result, we would like to see as many variables as possible with increasing slack. Given the diverse nature of the explanatory variables, it is unusual to see more than 60% of the variables with increasing slack or fewer than 40% of the variables with increasing slack. These extreme values are significant and predictive of the near-term direction of economic growth and often the equity market.
The 3-month moving average of the percentage of variables with increasing slack decreased from 59.0% to 56.4% in December. New evidence of economic weakness (or strength) often shows up first in this timely metric.
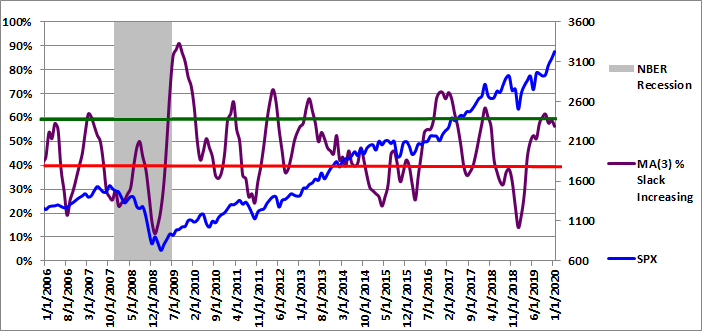
Figure 4: MA(3) % Slack Increasing 01-01-2020
The ability to track small variations and trend changes over time illustrates the advantage of monitoring the continuous recession slack index. The new slack variable provides additional insight into the near-term direction of the economy and should be used in conjunction with the median recession slack index.
While it is useful to track the actual recession slack index values and percentage of variables with increasing slack, the diffusion percentages and slack index values are also used to generate the more intuitive probit and logit probability forecasts.
Aggregate Recession Probability Estimate
The Trader Edge aggregate recession model averages the estimates from probit and logit models derived from the level and trend in a subset of the four variables described above: the original diffusion index, the 0.5-sigma diffusion index, the slack indices, and the percentage of variables with increasing slack. The aggregate recession model estimates from 1/1/2006 to 1/01/2020 are depicted in Figure 5 below (red line - left vertical axis). The gray shaded regions represent NBER recessions and the blue line reflects the value of the S&P 500 index (right vertical axis). I suggest using a warning threshold of between 20-30% for the aggregate recession model (green horizontal line).
The aggregate recession model probability estimate remained constant at 0.1% in December. According to the model, the probability that the U.S. is currently in a recession is extremely remote.
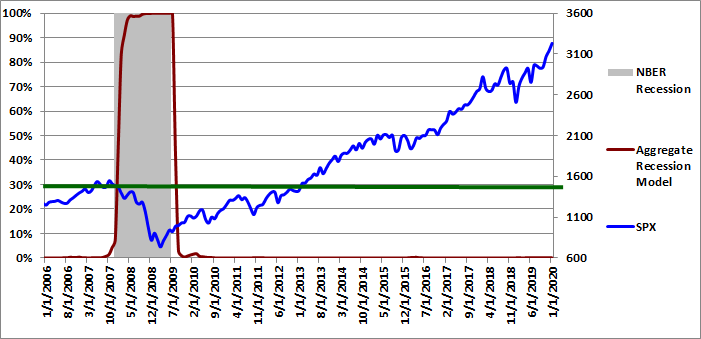
Figure 5: Aggregate Recession Model 01-01-2020
Aggregate Peak-Trough Probability Estimate
The peak-trough model forecasts are different from the recession model and are much more responsive. The peak-trough models estimate the probability of the S&P 500 being between the peak and trough associated with an NBER recession. The S&P 500 typically peaks before recessions begin and bottoms out before recessions end. As a result, it is far more difficult for the peak-trough model to fit this data and the model forecasts have larger errors than the recession model.
The Trader Edge aggregate peak-trough model is a weighted-average of the estimates from a number of different neural network models, all of which use the levels and trends of the four variables described above: the original diffusion index, the 0.5-sigma diffusion index, the slack indices, and the percentage of variables with increasing slack.
The aggregate peak-trough model estimates from 1/1/2006 to 1/01/2020 are depicted in Figure 6 below, which uses the same format as Figure 5, except that the shaded regions represent the periods between the peaks and troughs associated with NBER recessions.
The aggregate peak-trough model probability estimate for 1/01/2020 was 3.0%, which increased by 0.3% from last month's revised value of 2.7%. While this value is now low, note the recent spike to 18.9% at the end of October.
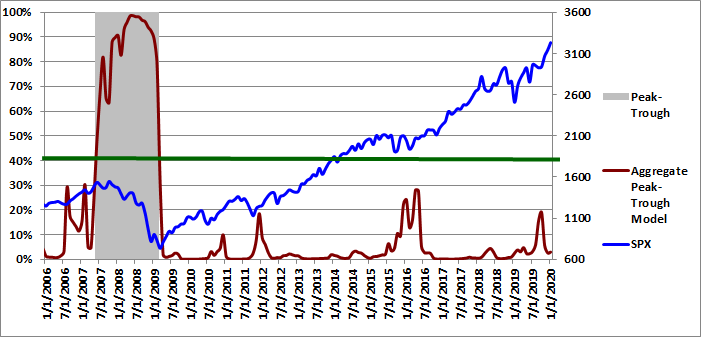
Figure 6: Aggregate Peak-Trough Model 01-01-2020
Conclusion
January and February 2016 marked a potential tipping point in U.S. recession risk, but those conditions proved to be temporary. Conditions improved significantly since early 2016, but many explanatory variables remain only marginal above their early warning thresholds.
Despite the low slack index values, U.S. recession risk remains low and relatively stable. The diffusion index has remained at zero (0.0%) since the end of March 2019. The new 0.5-sigma diffusion index increased from 30.8% to 34.6% in December. The mean and median recession slack indices both increased slightly; both slack indices remain marginally above the early warning threshold. The moving average of explanatory variables with increasing slack decreased from 59.0% to 56.4% in December. The aggregate recession probability remained constant at 0.1%. The peak-trough recession probability increased from 2.7% to 3.0%.
Even with the relatively low recession model probabilities, the limited protection offered by the levels of the recession slack indices continues to be a concern, especially with the weak global economy and ongoing trade war. Fortunately, the slack index values are now used directly in the new recession models and any further deterioration would be captured immediately by the new recession models.
Based on the most recent data, the equity allocation percentage regression model indicates that the expected annual price return of the S&P 500 index for the next 10 years is still negative (-0.4%), with an expected drawdown in that period of 36% (from 1/1/2020 levels). Expected price returns are still extremely low in a historical context, especially given the near-term market, economic, and geopolitical risks.
The "Buffett Indicator" regression model currently indicates that the expected annual price return of the S&P 500 index for the next 10 years is materially negative (-5.9%), with an expected drawdown in that 10-year period of 57% (from 12/1/2019 levels).
Overvalued markets can always become more overvalued - especially in the near-term. That said, history offers compelling evidence that bullish equity positions today will face significant headwinds over the coming years.
Unlike human prognosticators, the Trader Edge recession models are completely objective and have no ego. They are not burdened by the emotional need to defend past erroneous forecasts and will always consistently apply the insights gained from new data.
Brian Johnson
Copyright 2020 Trading Insights, LLC. All rights reserved.


Pingback: Recession Model Forecast: 03-01-2020 | Trader Edge
Pingback: Recession Model Forecast: 04-01-2020 | Trader Edge
Pingback: Recession Model Forecast: 05-01-2020 | Trader Edge
Pingback: Recession Model Forecast: 06-01-2020 | Trader Edge
Pingback: Recession Model Forecast: 07-01-2020 | Trader Edge
Pingback: Recession Model Forecast: 08-01-2020 | Trader Edge
Pingback: Recession Model Forecast: 09-01-2020 | Trader Edge
Pingback: Recession Model Forecast: 12-01-2020 | Trader Edge