I made a number of significant improvements to the recession model in January of 2020. If you missed the January recession model post, or if you would like to review the improvements to the models, please revisit the Recession Model Forecast: 01-01-2020. In the following months, I reduced the number of input variables in all of the peak-trough neural network models and expanded the number of individual models. I also further constrained the models, which made them even more robust - especially when interpreted as a single aggregate peak-trough forecast. Finally, due to the very large discrete changes in the economic data due to COVID-19, I capped the maximum standardized deviation above the recession threshold, which is particularly important when reporting the mean standardized deviation. No changes were made to any of the explanatory variables.
I also recently developed a SEIR model for COVID-19, with variables for the magnitude and timing of social distancing restrictions, as well a probabilistic variable for decaying immunity. The results were ominous and are not fully reflected in equity prices, especially after the very large rebound from the March 23rd lows in the last few months. I explained the Coronavirus model in an in-depth article titled: "New Coronavirus Model and the Economy," which I posted on April 1, 2020.
Monthly Update
This article updates the diffusion indices, recession slack index, aggregate recession model, and aggregate peak-trough model through July 2020. The explanatory variables are now capturing the effects of COVID-19 on the market and on the U.S. economy.
The current 26-variable model has a diverse set of explanatory variables and is quite robust. Each of the explanatory variables has predictive power individually; when combined, the group of indicators is able to identify early recession warnings from a wide range of diverse market-based, fundamental, technical, and economic sources.
Several of the explanatory variables are market-based. These variables are available in real-time (no lag), which means they respond very quickly to changing market conditions. In addition, they are never revised. This makes the Trader Edge recession model more responsive than many recession models. The current and historical data in this report reflect the current model configuration with all 26 variables.
Diffusion Index
The Trader Edge diffusion index equals the percentage of independent variables indicating a recession. With the latest changes, there are now a total of 26 explanatory variables, each with a unique look-back period and recession threshold. The resulting diffusion index and the trend in the diffusion index are two of the variables used to estimate the probit, logit, and neural network model forecasts.
The graph of the diffusion index from 1/1/2006 to 8/1/2020 is presented in Figure 1 below (in red - left axis). The gray shaded regions in Figure 1 below represent U.S. recessions as defined (after the fact) by the National Bureau of Economic Research (NBER). The value of the S&P 500 index is also included (in blue - right axis).
The U.S. economy flirted with entering a recession in early 2016, which was reflected in the deteriorating economic, fundamental, and especially market-based data. The diffusion index, slack index, and recession probability forecasts all captured the weakening conditions. However, the weakness proved to be temporary and the conditions and recession model forecasts improved rapidly.
Preliminary signs of weakness in the diffusion index reemerged in late 2018 and conditions deteriorated rapidly in December and January before rebounding in February through April of 2019 and stabilizing thereafter. However, the slack indices remained depressed throughout 2019.
COVID-19 and the resulting carnage from closing the economy hit the market in full-force in late February of 2020. The market plummeted in March, but has since staged the fastest recovery on record - surpassing the pre-COVID all-time highs in the S&P 500 and NASDAQ 100 Index.
The number of explanatory variables indicating a recession decreased from 16 (61.5%) to 9 (34.6%) in July, which was due to the continued rebound in the prices of risk-assets as well as the bottoming of several economic indicators as the U.S. economy continued to re-open.
Please note that past estimates and index values will change whenever the historical data is revised and/or whenever model improvements are implemented. All current and past forecasts and index calculations are based on the most recent models using the latest revised data from the current data set.
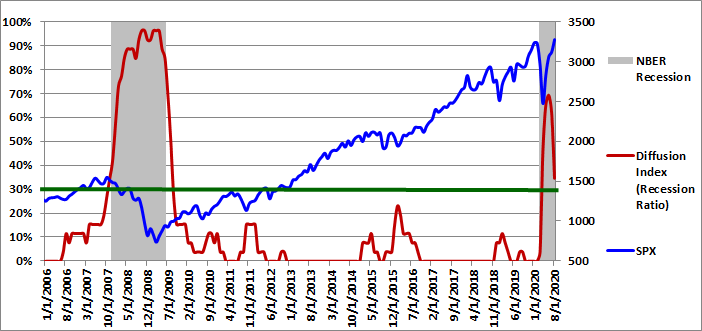
Figure 1: Diffusion Index 08-01-2020
0.5-Sigma Diffusion Index
The Trader Edge 0.5-sigma diffusion Index equals the percentage of explanatory variables with Z-scores that are less than 0.5 standard deviations above their respective recession thresholds. This new diffusion index is much more sensitive than the standard (zero-sigma) diffusion index. As a result, it provides much more detail on the health of the U.S. economy. The new 0.5-sigma diffusion index and the trend in the new diffusion index are two of the variables used to estimate the probit, logit, and neural network model forecasts.
The graph of the 0.5-sigma diffusion index from 1/1/2006 to 8/1/2020 is presented in Figure 2 below (in red - left axis). The gray shaded regions in Figure 2 below represent U.S. recessions as defined (after the fact) by the National Bureau of Economic Research (NBER). The value of the S&P 500 index is also included (in blue - right axis).
The percentage of explanatory variables with Z-scores below the 0.5-sigma early warning threshold declined from 76.9% to 65.4% in July. The additional level of detail provided by this more continuous and responsive metric is particularly valuable in the months leading up to or emerging from a recession, especially given the infrequent and more discrete movements of the standard (zero-sigma) diffusion index.
As I noted in past months, the percentage of variables with Z-scores below their respective 0.5 sigma thresholds had been unusually high, especially with the standard diffusion index equal to zero. This significantly reduced the potential cushion to any adverse economic shocks and accelerated the decline due to the Coronavirus.
This new 0.5-sigma diffusion index and the trend in the new diffusion index are now both used directly in the neural network recession models. When combined with the recession slack indices, the new diffusion index provides even greater insight into rapidly changing conditions.
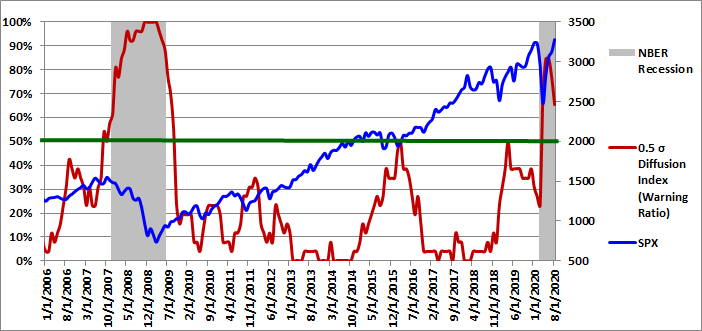
Figure 2: 0.5 Sigma Diffusion Index 08-01-2020
Recession Slack Indices
The Trader Edge recession slack index equals the median standardized deviation of the current value of the explanatory variables from their respective recession thresholds. The resulting value signifies the amount of slack or cushion relative to the recession threshold, expressed in terms of the number of standard deviations. Higher slack values signify larger cushions above recessionary threshold levels. While the median recession slack index is used in the recession models, I am now including the mean recession slack index in the graph as well. As I mentioned above, I am not capping the maximum standardized deviation for each explanatory variable before calculating the mean and median. I use both of these values in the neural network models and in the probit and logit models.
The gray shaded regions in Figure 3 below represent U.S. recessions as defined (after the fact) by the NBER. The median recession slack index is depicted in purple and is plotted against the right axis, which is expressed as the number of standard deviations above the recession threshold. The mean recession slack index is depicted in blue and is also plotted against the right axis.
The dark-red, horizontal line at 0.50 standard deviations denotes a possible warning threshold for the recession slack index. Many of the past recessions began when the recession slack index crossed below 0.50. Similarly, many of the past recessions ended when the recession slack index crossed back above 0.0.
In July 2020, the median recession slack index increased from -0.23 to +0.15. When this indicator moves from negative to positive, it has historically indicated the end of a recession. The mean recession slack index (affected more by outliers - even when capped) jumped from -1.41 to -0.43. Similar to the situation with the 0.5-sigma diffusion index, the mean and median slack indices had been unusually low before the recession. This made the U.S. economy particularly vulnerable to any adverse economic shocks, which accelerated the decline due to the Coronavirus. Note, all of these values reflect the new smoothed trend data.
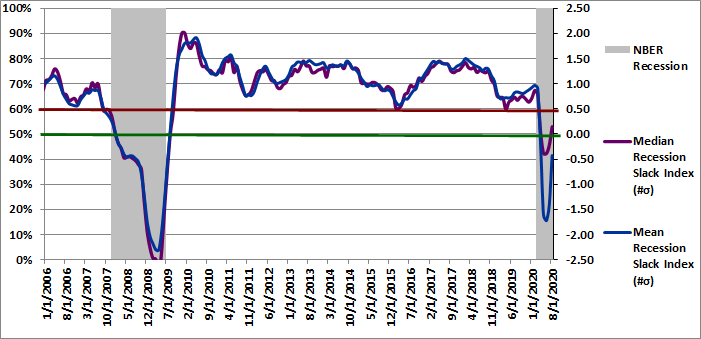
Figure 3: Recession Slack Indices 08-01-2020
To gain further insight into the slack index, I provide the three-month moving average of the percentage of variables with increasing slack in Figure 4, but I personally monitor the monthly percentages as well.
Slack is a standardized value, so it is directly comparable across all variables. More slack indicates a larger cushion relative to a recessionary environment. As a result, we would like to see as many variables as possible with increasing slack. Given the diverse nature of the explanatory variables, it is unusual to see more than 60% of the variables with increasing slack or fewer than 40% of the variables with increasing slack. These extreme values are significant and predictive of the near-term direction of economic growth and often the equity market.
The 3-month moving average of the percentage of variables with increasing slack increased from 30.8% to 52.6% in July. In the month of July alone, the percentage of variables with increasing slack spiked to 76.9%. New evidence of economic weakness (or strength) often shows up first in this timely metric.
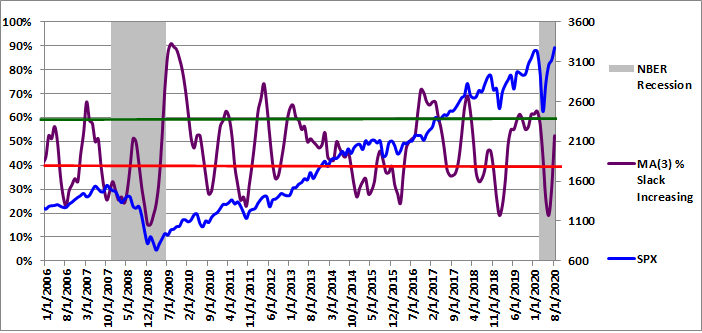
Figure 4: MA(3) % Slack Increasing 08-01-2020
The ability to track small variations and trend changes over time illustrates the advantage of monitoring the continuous recession slack index. The new slack variable provides additional insight into the near-term direction of the economy and should be used in conjunction with the median recession slack index.
While it is useful to track the actual recession slack index values and percentage of variables with increasing slack, the diffusion percentages and slack index values are also used to generate the more intuitive probit and logit probability forecasts.
Aggregate Recession Probability Estimate
The Trader Edge aggregate recession model averages the estimates from probit and logit models derived from the level and trend in a subset of the four variables described above: the original diffusion index, the 0.5-sigma diffusion index, the slack indices, and the percentage of variables with increasing slack. The aggregate recession model estimates from 1/1/2006 to 8/01/2020 are depicted in Figure 5 below (red line - left vertical axis). The gray shaded regions represent NBER recessions and the blue line reflects the value of the S&P 500 index (right vertical axis). I suggest using a warning threshold of between 20-30% for the aggregate recession model (green horizontal line).
The aggregate recession model probability estimate dropped from 82.5% to 32.6% in July. It is becoming increasingly likely that the U.S. economy has bottomed and may have already emerged from the recession.
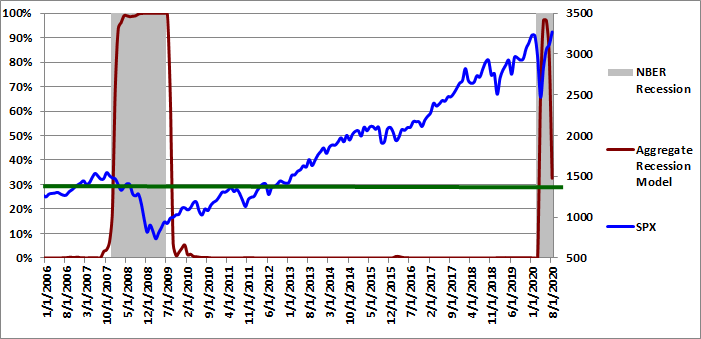
Figure 5: Aggregate Recession Model 08-01-2020
Aggregate Peak-Trough Probability Estimate
The peak-trough model forecasts are different from the recession model and are much more responsive. The peak-trough models estimate the probability of the S&P 500 being between the peak and trough associated with an NBER recession. The S&P 500 typically peaks before recessions begin and bottoms out before recessions end. As a result, it is far more difficult for the peak-trough model to fit this data and the model forecasts have larger errors than the recession model.
The Trader Edge aggregate peak-trough model is a weighted-average of the estimates from a number different neural network models, all of which use the levels and trends of the diffusion and slack indices described above.
The aggregate peak-trough model estimates from 1/1/2006 to 8/01/2020 are depicted in Figure 6 below, which uses the same format as Figure 5, except that the shaded regions represent the periods between the peaks and troughs associated with NBER recessions. The value of the S&P 500 index is also included (in blue - right axis).
The aggregate peak-trough model probability estimate for 8/01/2020 was 76.4%, which declined significantly from the June reading of 100%.
The probability forecasts are continuous, but when the probabilities are elevated, modest changes from month to month (even 10-15%) are not unusual. As a result, it can also be useful to use a discrete cutoff value (such as 40-50%) to make a discrete (0/1) recession or peak-trough determination.
I also wanted to note that all of the recession models were designed to identify "typical" recessions, with gradual weakening metrics preceding the recession and gradual strengthening metrics as the economy emerges from the recession. The models use trends in the data, but these trend changes could be more rapid due to the discrete nature of economic restrictions imposed by federal and state governments due to COVID-19. I was concerned that this could be a particular challenge for the models when exiting the current recession, but the models appear to be more responsive than initially anticipated.
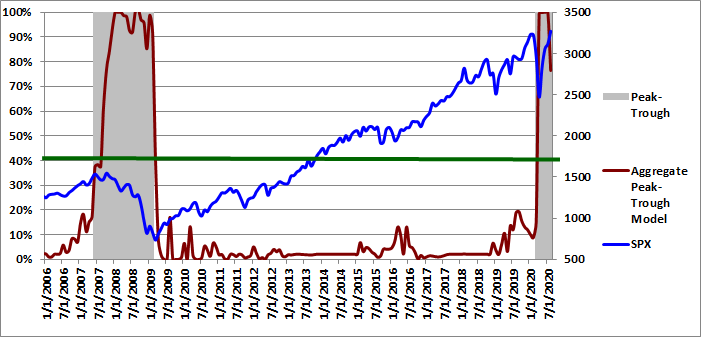
Figure 6: Aggregate Peak-Trough Model 08-01-2020
Conclusion
The diffusion indices, slack indices, and the recession model forecasts generally improved substantially in July. The diffusion index decreased from 16 (61.5%) to 9 (34.6%) in July. The new 0.5-sigma diffusion index dropped from 76.9% to 65.4%. The mean and median recession slack indices were +0.15 and -0.43 respectively. The moving average of explanatory variables with increasing slack increased from 30.8% to 52.6% in July. The aggregate recession probability dropped from 82.5% to 32.6%. The peak-trough recession probability declined from 100% to 76.4%.
Typically, the environment after emerging from a recession offers very attractive buying opportunities for equities with high risk-adjusted expected returns. Valuation levels are usually very low due to elevated risk premiums. In addition, near-term growth rates following a recession are usually high. Unfortunately, the current environment is very different.
Based on the most recent data, the equity allocation percentage regression model indicates that the expected annual price return of the S&P 500 index for the next 10 years remains extremely low at -0.02% with an expected drawdown in that period of 35% (from 8/1/2020 levels). The low expected future return is due to the sharp rebound in equity prices since March 23rd. Expected future equity returns are still quite low in a historical context, especially given the near-term market, economic, and virus-related risks.
The "Buffett Indicator" regression model currently indicates that the expected annual price return of the S&P 500 index for the next 10 years is still alarmingly negative (-7.7%), with an expected drawdown in that 10-year period of 63% (from 8/1/2020 levels).
Given the unprecedented and ongoing effects of shutting down and partially re-opening the U.S. and global economies, I am using the Atlanta GDPNow Cast when calculating the most recent Buffet Indicator ratio. The latest annualized estimate for Q3 is +25.6%. Similar forward-looking adjustments would be required when calculating P/E or other valuation ratios. The resulting Buffett ratio incorporates forward-looking near-term GDP estimates as well as market data as of 8/1/2020. The most recent Buffett Indicator value was higher than 99% of the historical Buffett Indicator ratios since 1951. History offers compelling evidence that bullish equity positions today will face depressed returns over the coming years.
On a related note, there is also a shocking disconnect between earnings estimates and equity prices. As I write this, the S&P 500 Index is above its pre-COVID all-time high. At the same time, the latest bottom-up S&P 500 earnings estimates for 2020 and 2021 have declined by 27% and 16% respectively from their pre-COVID highs. In other words, equity market participants are currently paying a higher price for dramatically lower earnings, with all of the ongoing risks of COVID-19. This is one of the largest disparities between price and fundamentals that I have ever seen and is reminiscent of the tech bubble in 2000. Given that earnings are the main drivers of long-term value in the equity market, this unprecedented divergence adds another material element of risk to the market.
This type of multiple expansion is typically associated with a reduction in risk premiums, the expectation of extremely rapid growth, or both. Given the near-term risks of COVID-19 and the uncertainty of the upcoming presidential election, it is difficult to defend compressed risk premiums. While near-term earnings growth should be rapid as the U.S. economy reopens, it is much more difficult to make the case that this rapid earnings growth would continue after earnings eventually reach their pre-COVID 2021 estimates. The long-term health, behavioral, budgetary, default, productivity, and economic effects of COVID are unknown, but it seems likely that all of these effects could create a drag on future growth, potentially for many years. However, I acknowledge that the level of liquidity the Fed has injected into the market is unprecedented - and bubbles can continue for extended periods before they pop.
On a related note, in his recent article titled "This is the simple reason you can’t believe the P/E ratio for the Russell 2000 right now", Mark Hulbert reported that the current P/E ratio of the Russell 2000 Index (adjusted for negative earnings) was an astounding 132. In other words, Russell 2000 investors are currently paying $132 for every $1 of forward earnings (which have historically been notoriously overstated). The true P/E ratio of an equity market index (adjusted for negative earnings) is rarely published and is not typically available to most market participants.
Unlike human prognosticators, the Trader Edge recession models are completely objective and have no ego. They are not burdened by the emotional need to defend past erroneous forecasts and will always consistently apply the insights gained from new data.
Brian Johnson
Copyright 2020 Trading Insights, LLC. All rights reserved.
Option Strategy Risk Management: An In-Depth Article Introducing an Interactive Analytical Framework for Hedging Option Strategy Risk
Option Income Strategy Trade Filters: An In-Depth Article Demonstrating the Use of Trade Filters to Enhance Returns and Reduce Risk
Exploiting Earnings Volatility: An Innovative New Approach to Evaluating, Optimizing, and Trading Option Strategies to Profit from Earnings Announcements.
Option Strategy Risk / Return Ratios: A Revolutionary New Approach to Optimizing, Adjusting, and Trading Any Option Income Strategy


Recession Model Forecast: 08-01-2020
I made a number of significant improvements to the recession model in January of 2020. If you missed the January recession model post, or if you would like to review the improvements to the models, please revisit the Recession Model Forecast: 01-01-2020. In the following months, I reduced the number of input variables in all of the peak-trough neural network models and expanded the number of individual models. I also further constrained the models, which made them even more robust - especially when interpreted as a single aggregate peak-trough forecast. Finally, due to the very large discrete changes in the economic data due to COVID-19, I capped the maximum standardized deviation above the recession threshold, which is particularly important when reporting the mean standardized deviation. No changes were made to any of the explanatory variables.
I also recently developed a SEIR model for COVID-19, with variables for the magnitude and timing of social distancing restrictions, as well a probabilistic variable for decaying immunity. The results were ominous and are not fully reflected in equity prices, especially after the very large rebound from the March 23rd lows in the last few months. I explained the Coronavirus model in an in-depth article titled: "New Coronavirus Model and the Economy," which I posted on April 1, 2020.
Monthly Update
This article updates the diffusion indices, recession slack index, aggregate recession model, and aggregate peak-trough model through July 2020. The explanatory variables are now capturing the effects of COVID-19 on the market and on the U.S. economy.
The current 26-variable model has a diverse set of explanatory variables and is quite robust. Each of the explanatory variables has predictive power individually; when combined, the group of indicators is able to identify early recession warnings from a wide range of diverse market-based, fundamental, technical, and economic sources.
Several of the explanatory variables are market-based. These variables are available in real-time (no lag), which means they respond very quickly to changing market conditions. In addition, they are never revised. This makes the Trader Edge recession model more responsive than many recession models. The current and historical data in this report reflect the current model configuration with all 26 variables.
Diffusion Index
The Trader Edge diffusion index equals the percentage of independent variables indicating a recession. With the latest changes, there are now a total of 26 explanatory variables, each with a unique look-back period and recession threshold. The resulting diffusion index and the trend in the diffusion index are two of the variables used to estimate the probit, logit, and neural network model forecasts.
The graph of the diffusion index from 1/1/2006 to 8/1/2020 is presented in Figure 1 below (in red - left axis). The gray shaded regions in Figure 1 below represent U.S. recessions as defined (after the fact) by the National Bureau of Economic Research (NBER). The value of the S&P 500 index is also included (in blue - right axis).
The U.S. economy flirted with entering a recession in early 2016, which was reflected in the deteriorating economic, fundamental, and especially market-based data. The diffusion index, slack index, and recession probability forecasts all captured the weakening conditions. However, the weakness proved to be temporary and the conditions and recession model forecasts improved rapidly.
Preliminary signs of weakness in the diffusion index reemerged in late 2018 and conditions deteriorated rapidly in December and January before rebounding in February through April of 2019 and stabilizing thereafter. However, the slack indices remained depressed throughout 2019.
COVID-19 and the resulting carnage from closing the economy hit the market in full-force in late February of 2020. The market plummeted in March, but has since staged the fastest recovery on record - surpassing the pre-COVID all-time highs in the S&P 500 and NASDAQ 100 Index.
The number of explanatory variables indicating a recession decreased from 16 (61.5%) to 9 (34.6%) in July, which was due to the continued rebound in the prices of risk-assets as well as the bottoming of several economic indicators as the U.S. economy continued to re-open.
Please note that past estimates and index values will change whenever the historical data is revised and/or whenever model improvements are implemented. All current and past forecasts and index calculations are based on the most recent models using the latest revised data from the current data set.
Figure 1: Diffusion Index 08-01-2020
0.5-Sigma Diffusion Index
The Trader Edge 0.5-sigma diffusion Index equals the percentage of explanatory variables with Z-scores that are less than 0.5 standard deviations above their respective recession thresholds. This new diffusion index is much more sensitive than the standard (zero-sigma) diffusion index. As a result, it provides much more detail on the health of the U.S. economy. The new 0.5-sigma diffusion index and the trend in the new diffusion index are two of the variables used to estimate the probit, logit, and neural network model forecasts.
The graph of the 0.5-sigma diffusion index from 1/1/2006 to 8/1/2020 is presented in Figure 2 below (in red - left axis). The gray shaded regions in Figure 2 below represent U.S. recessions as defined (after the fact) by the National Bureau of Economic Research (NBER). The value of the S&P 500 index is also included (in blue - right axis).
The percentage of explanatory variables with Z-scores below the 0.5-sigma early warning threshold declined from 76.9% to 65.4% in July. The additional level of detail provided by this more continuous and responsive metric is particularly valuable in the months leading up to or emerging from a recession, especially given the infrequent and more discrete movements of the standard (zero-sigma) diffusion index.
As I noted in past months, the percentage of variables with Z-scores below their respective 0.5 sigma thresholds had been unusually high, especially with the standard diffusion index equal to zero. This significantly reduced the potential cushion to any adverse economic shocks and accelerated the decline due to the Coronavirus.
This new 0.5-sigma diffusion index and the trend in the new diffusion index are now both used directly in the neural network recession models. When combined with the recession slack indices, the new diffusion index provides even greater insight into rapidly changing conditions.
Figure 2: 0.5 Sigma Diffusion Index 08-01-2020
Recession Slack Indices
The Trader Edge recession slack index equals the median standardized deviation of the current value of the explanatory variables from their respective recession thresholds. The resulting value signifies the amount of slack or cushion relative to the recession threshold, expressed in terms of the number of standard deviations. Higher slack values signify larger cushions above recessionary threshold levels. While the median recession slack index is used in the recession models, I am now including the mean recession slack index in the graph as well. As I mentioned above, I am not capping the maximum standardized deviation for each explanatory variable before calculating the mean and median. I use both of these values in the neural network models and in the probit and logit models.
The gray shaded regions in Figure 3 below represent U.S. recessions as defined (after the fact) by the NBER. The median recession slack index is depicted in purple and is plotted against the right axis, which is expressed as the number of standard deviations above the recession threshold. The mean recession slack index is depicted in blue and is also plotted against the right axis.
The dark-red, horizontal line at 0.50 standard deviations denotes a possible warning threshold for the recession slack index. Many of the past recessions began when the recession slack index crossed below 0.50. Similarly, many of the past recessions ended when the recession slack index crossed back above 0.0.
In July 2020, the median recession slack index increased from -0.23 to +0.15. When this indicator moves from negative to positive, it has historically indicated the end of a recession. The mean recession slack index (affected more by outliers - even when capped) jumped from -1.41 to -0.43. Similar to the situation with the 0.5-sigma diffusion index, the mean and median slack indices had been unusually low before the recession. This made the U.S. economy particularly vulnerable to any adverse economic shocks, which accelerated the decline due to the Coronavirus. Note, all of these values reflect the new smoothed trend data.
Figure 3: Recession Slack Indices 08-01-2020
To gain further insight into the slack index, I provide the three-month moving average of the percentage of variables with increasing slack in Figure 4, but I personally monitor the monthly percentages as well.
Slack is a standardized value, so it is directly comparable across all variables. More slack indicates a larger cushion relative to a recessionary environment. As a result, we would like to see as many variables as possible with increasing slack. Given the diverse nature of the explanatory variables, it is unusual to see more than 60% of the variables with increasing slack or fewer than 40% of the variables with increasing slack. These extreme values are significant and predictive of the near-term direction of economic growth and often the equity market.
The 3-month moving average of the percentage of variables with increasing slack increased from 30.8% to 52.6% in July. In the month of July alone, the percentage of variables with increasing slack spiked to 76.9%. New evidence of economic weakness (or strength) often shows up first in this timely metric.
Figure 4: MA(3) % Slack Increasing 08-01-2020
The ability to track small variations and trend changes over time illustrates the advantage of monitoring the continuous recession slack index. The new slack variable provides additional insight into the near-term direction of the economy and should be used in conjunction with the median recession slack index.
While it is useful to track the actual recession slack index values and percentage of variables with increasing slack, the diffusion percentages and slack index values are also used to generate the more intuitive probit and logit probability forecasts.
Aggregate Recession Probability Estimate
The Trader Edge aggregate recession model averages the estimates from probit and logit models derived from the level and trend in a subset of the four variables described above: the original diffusion index, the 0.5-sigma diffusion index, the slack indices, and the percentage of variables with increasing slack. The aggregate recession model estimates from 1/1/2006 to 8/01/2020 are depicted in Figure 5 below (red line - left vertical axis). The gray shaded regions represent NBER recessions and the blue line reflects the value of the S&P 500 index (right vertical axis). I suggest using a warning threshold of between 20-30% for the aggregate recession model (green horizontal line).
The aggregate recession model probability estimate dropped from 82.5% to 32.6% in July. It is becoming increasingly likely that the U.S. economy has bottomed and may have already emerged from the recession.
Figure 5: Aggregate Recession Model 08-01-2020
Aggregate Peak-Trough Probability Estimate
The peak-trough model forecasts are different from the recession model and are much more responsive. The peak-trough models estimate the probability of the S&P 500 being between the peak and trough associated with an NBER recession. The S&P 500 typically peaks before recessions begin and bottoms out before recessions end. As a result, it is far more difficult for the peak-trough model to fit this data and the model forecasts have larger errors than the recession model.
The Trader Edge aggregate peak-trough model is a weighted-average of the estimates from a number different neural network models, all of which use the levels and trends of the diffusion and slack indices described above.
The aggregate peak-trough model estimates from 1/1/2006 to 8/01/2020 are depicted in Figure 6 below, which uses the same format as Figure 5, except that the shaded regions represent the periods between the peaks and troughs associated with NBER recessions. The value of the S&P 500 index is also included (in blue - right axis).
The aggregate peak-trough model probability estimate for 8/01/2020 was 76.4%, which declined significantly from the June reading of 100%.
The probability forecasts are continuous, but when the probabilities are elevated, modest changes from month to month (even 10-15%) are not unusual. As a result, it can also be useful to use a discrete cutoff value (such as 40-50%) to make a discrete (0/1) recession or peak-trough determination.
I also wanted to note that all of the recession models were designed to identify "typical" recessions, with gradual weakening metrics preceding the recession and gradual strengthening metrics as the economy emerges from the recession. The models use trends in the data, but these trend changes could be more rapid due to the discrete nature of economic restrictions imposed by federal and state governments due to COVID-19. I was concerned that this could be a particular challenge for the models when exiting the current recession, but the models appear to be more responsive than initially anticipated.
Figure 6: Aggregate Peak-Trough Model 08-01-2020
Conclusion
The diffusion indices, slack indices, and the recession model forecasts generally improved substantially in July. The diffusion index decreased from 16 (61.5%) to 9 (34.6%) in July. The new 0.5-sigma diffusion index dropped from 76.9% to 65.4%. The mean and median recession slack indices were +0.15 and -0.43 respectively. The moving average of explanatory variables with increasing slack increased from 30.8% to 52.6% in July. The aggregate recession probability dropped from 82.5% to 32.6%. The peak-trough recession probability declined from 100% to 76.4%.
Typically, the environment after emerging from a recession offers very attractive buying opportunities for equities with high risk-adjusted expected returns. Valuation levels are usually very low due to elevated risk premiums. In addition, near-term growth rates following a recession are usually high. Unfortunately, the current environment is very different.
Based on the most recent data, the equity allocation percentage regression model indicates that the expected annual price return of the S&P 500 index for the next 10 years remains extremely low at -0.02% with an expected drawdown in that period of 35% (from 8/1/2020 levels). The low expected future return is due to the sharp rebound in equity prices since March 23rd. Expected future equity returns are still quite low in a historical context, especially given the near-term market, economic, and virus-related risks.
The "Buffett Indicator" regression model currently indicates that the expected annual price return of the S&P 500 index for the next 10 years is still alarmingly negative (-7.7%), with an expected drawdown in that 10-year period of 63% (from 8/1/2020 levels).
Given the unprecedented and ongoing effects of shutting down and partially re-opening the U.S. and global economies, I am using the Atlanta GDPNow Cast when calculating the most recent Buffet Indicator ratio. The latest annualized estimate for Q3 is +25.6%. Similar forward-looking adjustments would be required when calculating P/E or other valuation ratios. The resulting Buffett ratio incorporates forward-looking near-term GDP estimates as well as market data as of 8/1/2020. The most recent Buffett Indicator value was higher than 99% of the historical Buffett Indicator ratios since 1951. History offers compelling evidence that bullish equity positions today will face depressed returns over the coming years.
On a related note, there is also a shocking disconnect between earnings estimates and equity prices. As I write this, the S&P 500 Index is above its pre-COVID all-time high. At the same time, the latest bottom-up S&P 500 earnings estimates for 2020 and 2021 have declined by 27% and 16% respectively from their pre-COVID highs. In other words, equity market participants are currently paying a higher price for dramatically lower earnings, with all of the ongoing risks of COVID-19. This is one of the largest disparities between price and fundamentals that I have ever seen and is reminiscent of the tech bubble in 2000. Given that earnings are the main drivers of long-term value in the equity market, this unprecedented divergence adds another material element of risk to the market.
This type of multiple expansion is typically associated with a reduction in risk premiums, the expectation of extremely rapid growth, or both. Given the near-term risks of COVID-19 and the uncertainty of the upcoming presidential election, it is difficult to defend compressed risk premiums. While near-term earnings growth should be rapid as the U.S. economy reopens, it is much more difficult to make the case that this rapid earnings growth would continue after earnings eventually reach their pre-COVID 2021 estimates. The long-term health, behavioral, budgetary, default, productivity, and economic effects of COVID are unknown, but it seems likely that all of these effects could create a drag on future growth, potentially for many years. However, I acknowledge that the level of liquidity the Fed has injected into the market is unprecedented - and bubbles can continue for extended periods before they pop.
On a related note, in his recent article titled "This is the simple reason you can’t believe the P/E ratio for the Russell 2000 right now", Mark Hulbert reported that the current P/E ratio of the Russell 2000 Index (adjusted for negative earnings) was an astounding 132. In other words, Russell 2000 investors are currently paying $132 for every $1 of forward earnings (which have historically been notoriously overstated). The true P/E ratio of an equity market index (adjusted for negative earnings) is rarely published and is not typically available to most market participants.
Unlike human prognosticators, the Trader Edge recession models are completely objective and have no ego. They are not burdened by the emotional need to defend past erroneous forecasts and will always consistently apply the insights gained from new data.
Brian Johnson
Copyright 2020 Trading Insights, LLC. All rights reserved.
Option Strategy Risk Management: An In-Depth Article Introducing an Interactive Analytical Framework for Hedging Option Strategy Risk
Option Income Strategy Trade Filters: An In-Depth Article Demonstrating the Use of Trade Filters to Enhance Returns and Reduce Risk
Exploiting Earnings Volatility: An Innovative New Approach to Evaluating, Optimizing, and Trading Option Strategies to Profit from Earnings Announcements.
Option Strategy Risk / Return Ratios: A Revolutionary New Approach to Optimizing, Adjusting, and Trading Any Option Income Strategy
About Brian Johnson
I have been an investment professional for over 30 years. I worked as a fixed income portfolio manager, personally managing over $13 billion in assets for institutional clients. I was also the President of a financial consulting and software development firm, developing artificial intelligence based forecasting and risk management systems for institutional investment managers. I am now a full-time proprietary trader in options, futures, stocks, and ETFs using both algorithmic and discretionary trading strategies. In addition to my professional investment experience, I designed and taught courses in financial derivatives for both MBA and undergraduate business programs on a part-time basis for a number of years. I have also written four books on options and derivative strategies.