I made a number of significant improvements to the recession model in January of 2020. If you missed the January recession model post, or if you would like to review the improvements to the models, please revisit the Recession Model Forecast: 01-01-2020. Last month, I reduced the number of input variables in all of the peak-trough neural network models and expanded the number of individual models. I continued to work with the neutral network models this month, further constraining the models, which made them even more robust - especially when interpreted as a single aggregate peak-trough forecast. No changes were made to any of the explanatory variables.
I also recently developed a SEIR model for COVID-19, with variables for the magnitude and timing of social distancing restrictions, as well a probabilistic variable for decaying immunity. The results were ominous and are not fully reflected in equity prices, especially after the very large rebound from the March 23rd lows in April and May month-to-date. The growth rate in new Coronavirus cases is only slightly less than my model estimates during the social distancing phase. I documented the model results in an in-depth article titled: "New Coronavirus Model and the Economy," which I posted on April 1, 2020.
Monthly Update
This article updates the diffusion indices, recession slack index, aggregate recession model, and aggregate peak-trough model through April 2020. Most of the explanatory variables are now capturing the effects of COVID-19 on the market and on the U.S. economy - however, there are still a few data series that have more pronounced delays.
The current 26-variable model has a diverse set of explanatory variables and is quite robust. Each of the explanatory variables has predictive power individually; when combined, the group of indicators is able to identify early recession warnings from a wide range of diverse market-based, fundamental, technical, and economic sources.
Several of the explanatory variables are market-based. These variables are available in real-time (no lag), which means they respond very quickly to changing market conditions. In addition, they are never revised. This makes the Trader Edge recession model more responsive than many recession models. The current and historical data in this report reflect the current model configuration with all 26 variables.
Diffusion Index
The Trader Edge diffusion index equals the percentage of independent variables indicating a recession. With the latest changes, there are now a total of 26 explanatory variables, each with a unique look-back period and recession threshold. The resulting diffusion index and the trend in the diffusion index are two of the variables used to estimate the probit, logit, and neural network model forecasts.
The graph of the diffusion index from 1/1/2006 to 5/1/2020 is presented in Figure 1 below (in red - left axis). The gray shaded regions in Figure 1 below represent U.S. recessions as defined (after the fact) by the National Bureau of Economic Research (NBER). Due to the typical NBER delay, I have preliminarily shaded the likely beginning of a new U.S. recession in March 2020. The value of the S&P 500 index is also included (in blue - right axis).
The U.S. economy flirted with entering a recession in early 2016, which was reflected in the deteriorating economic, fundamental, and especially market-based data. The diffusion index, slack index, and recession probability forecasts all captured the weakening conditions. However, the weakness proved to be temporary and the conditions and recession model forecasts improved rapidly.
Preliminary signs of weakness in the diffusion index reemerged in late 2018 and conditions deteriorated rapidly in December and January before rebounding in February through April of 2019 and stabilizing thereafter. However, the slack indices remained depressed throughout 2019.
Upon detailed examination of the individual economic data series, it is clear that the Government shutdown temporarily affected the economic data in early 2019. The most recent economic data is no longer affected, but the shutdown did temporarily affect the look-back data and the resulting trends. I initially went back and smoothed the trend data for every economic variable, but the new trend calculation is even more effective at reducing the impact of outliers, which makes it more robust. Smoothing the look-back data mitigates the impact of all such data outliers now and in the future.
The number of explanatory variables indicating a recession jumped from 11 (42.3%) to 16 (61.5%) in April, which is the highest diffusion index value since the great recession - by far.
As explained above, it will take another month or so before the effects of the coronavirus are fully reflected in all of the explanatory variables, but most of these variables are already capturing these effects.
Please note that past estimates and index values will change whenever the historical data is revised and/or whenever model improvements are implemented. All current and past forecasts and index calculations are based on the most recent models using the latest revised data from the current data set.
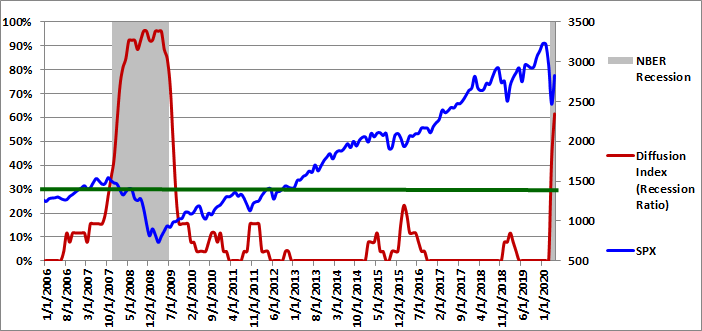
Figure 1: Diffusion Index 05-01-2020
0.5-Sigma Diffusion Index
The Trader Edge 0.5-sigma diffusion Index equals the percentage of explanatory variables with Z-scores that are less than 0.5 standard deviations above their respective recession thresholds. This new diffusion index is much more sensitive than the standard (zero-sigma) diffusion index. As a result, it provides much more detail on the health of the U.S. economy. The new 0.5-sigma diffusion index and the trend in the new diffusion index are two of the variables used to estimate the probit, logit, and neural network model forecasts.
The graph of the 0.5-sigma diffusion index from 1/1/2006 to 5/1/2020 is presented in Figure 2 below (in red - left axis). The gray shaded regions in Figure 2 below represent U.S. recessions as defined (after the fact) by the National Bureau of Economic Research (NBER). The value of the S&P 500 index is also included (in blue - right axis). As explained above, I have preliminarily shaded the likely beginning of a new U.S. recession in March 2020.
The percentage of explanatory variables with Z-scores below the 0.5-sigma early warning threshold spiked from 73.1% to 80.8% in April, almost exclusively due to the economic effects of Coronavirus. The additional level of detail provided by this more continuous and responsive metric will be invaluable going forward, especially given the infrequent and more discrete movements of the standard (zero-sigma) diffusion index.
As I noted in past months, the percentage of variables with Z-scores below their respective 0.5 sigma thresholds had been unusually high, especially with the standard diffusion index equal to zero. This significantly reduced the potential cushion to any adverse economic shocks and accelerated the decline due to the Coronavirus.
This new 0.5-sigma diffusion index and the trend in the new diffusion index are now both used directly in the neural network recession models. When combined with the recession slack indices, the new diffusion index provides even greater insight into rapidly changing conditions.
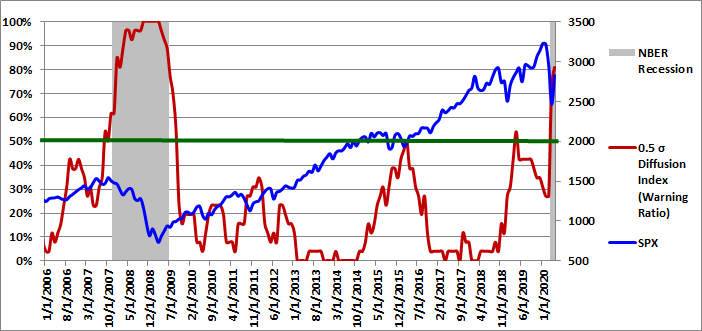
Figure 2: 0.5 Sigma Diffusion Index 05-01-2020
Recession Slack Indices
The Trader Edge recession slack index equals the median standardized deviation of the current value of the explanatory variables from their respective recession thresholds. The resulting value signifies the amount of slack or cushion relative to the recession threshold, expressed in terms of the number of standard deviations. Higher slack values signify larger cushions above recessionary threshold levels. While the median recession slack index is used in the recession models, I am now including the mean recession slack index in the graph as well. I use both of these values in the neural network models and in the probit and logit models.
The gray shaded regions in Figure 3 below represent U.S. recessions as defined (after the fact) by the NBER. The median recession slack index is depicted in purple and is plotted against the right axis, which is expressed as the number of standard deviations above the recession threshold. The mean recession slack index is depicted in blue and is also plotted against the right axis.
The dark-red, horizontal line at 0.50 standard deviations denotes a possible warning threshold for the recession slack index. Many of the past recessions began when the recession slack index crossed below 0.50. Similarly, many of the past recessions ended when the recession slack index crossed back above 0.0.
In April 2020, the median recession slack index plunged from 0.10 to -0.23. The mean recession slack index (affected more by outliers) plummeted from -0.18 to -1.94. Similar to the situation with the 0.5-sigma diffusion index, the mean and median slack indices had been unusually low. This made the U.S. economy particularly vulnerable to any adverse economic shocks, which accelerated the decline due to the Coronavirus. Note, all of these values reflect the new smoothed trend data.
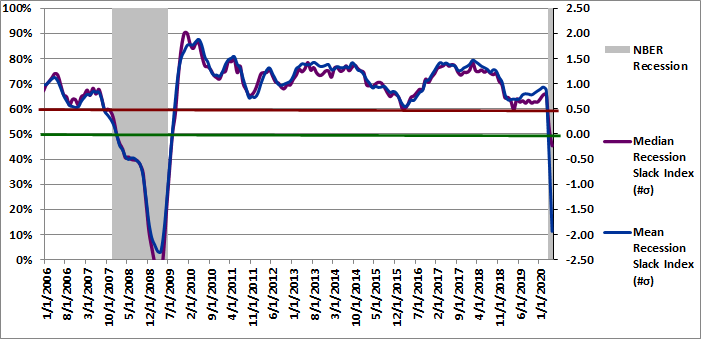
Figure 3: Recession Slack Index 05-01-2020
To gain further insight into the slack index, I provide the three-month moving average of the percentage of variables with increasing slack in Figure 4, but I personally monitor the monthly percentages as well.
Slack is a standardized value, so it is directly comparable across all variables. More slack indicates a larger cushion relative to a recessionary environment. As a result, we would like to see as many variables as possible with increasing slack. Given the diverse nature of the explanatory variables, it is unusual to see more than 60% of the variables with increasing slack or fewer than 40% of the variables with increasing slack. These extreme values are significant and predictive of the near-term direction of economic growth and often the equity market.
The 3-month moving average of the percentage of variables with increasing slack decreased sharply from 44.9% to 26.9% in April. The percentage of variables with increasing slack was only 11.5% in April - the lowest monthly value since November 2008. New evidence of economic weakness (or strength) often shows up first in this timely metric.
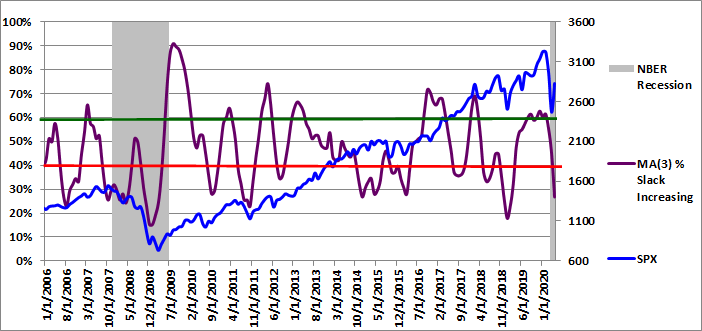
Figure 4: MA(3) % Slack Increasing 05-01-2020
The ability to track small variations and trend changes over time illustrates the advantage of monitoring the continuous recession slack index. The new slack variable provides additional insight into the near-term direction of the economy and should be used in conjunction with the median recession slack index.
While it is useful to track the actual recession slack index values and percentage of variables with increasing slack, the diffusion percentages and slack index values are also used to generate the more intuitive probit and logit probability forecasts.
Aggregate Recession Probability Estimate
The Trader Edge aggregate recession model averages the estimates from probit and logit models derived from the level and trend in a subset of the four variables described above: the original diffusion index, the 0.5-sigma diffusion index, the slack indices, and the percentage of variables with increasing slack. The aggregate recession model estimates from 1/1/2006 to 5/01/2020 are depicted in Figure 5 below (red line - left vertical axis). The gray shaded regions represent NBER recessions and the blue line reflects the value of the S&P 500 index (right vertical axis). As explained above, I have preliminarily shaded the likely beginning of a new U.S. recession in March 2020. I suggest using a warning threshold of between 20-30% for the aggregate recession model (green horizontal line).
The aggregate recession model probability estimate jumped from 62.0% to 94.4% in April. It is now a virtual certainty that the U.S. is currently in a recession.
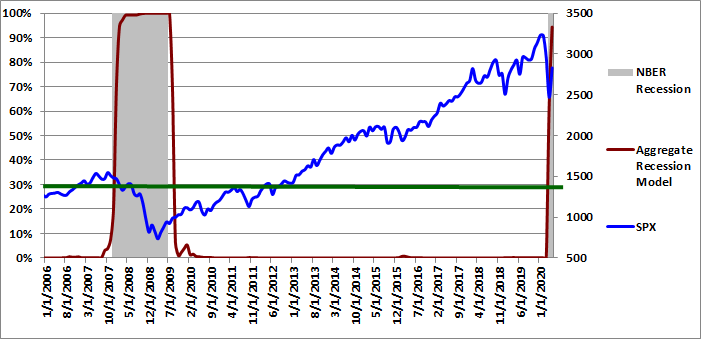
Figure 5: Aggregate Recession Model 05-01-2020
Aggregate Peak-Trough Probability Estimate
The peak-trough model forecasts are different from the recession model and are much more responsive. The peak-trough models estimate the probability of the S&P 500 being between the peak and trough associated with an NBER recession. The S&P 500 typically peaks before recessions begin and bottoms out before recessions end. As a result, it is far more difficult for the peak-trough model to fit this data and the model forecasts have larger errors than the recession model.
The Trader Edge aggregate peak-trough model is a weighted-average of the estimates from a number different neural network models, all of which use the levels and trends of the diffusion and slack indices described above.
The aggregate peak-trough model estimates from 1/1/2006 to 5/01/2020 are depicted in Figure 6 below, which uses the same format as Figure 5, except that the shaded regions represent the periods between the peaks and troughs associated with NBER recessions. Due the unavoidable NBER delay, I have preliminarily shaded the likely peak associated with the beginning of a new U.S. recession in February 2020. The value of the S&P 500 index is also included (in blue - right axis).
The aggregate peak-trough model probability estimate for 5/01/2020 was 96.3%, which is almost unchanged from last months revised value of 96.6%. It is highly likely that the S&P 500 index is now between the peak and trough associated with a new U.S. recession.
The probability forecasts are continuous, but when the probabilities are elevated, modest changes from month to month (even 10-15%) are not unusual. As a result, it can also be useful to use a discrete cutoff value (such as 50%) to make a discrete (0/1) recession or peak-trough determination.
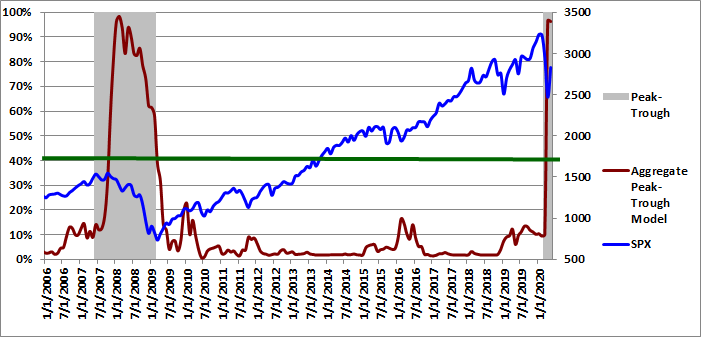
Figure 6: Aggregate Peak-Trough Model 05-01-2020
Conclusion
The diffusion indices, slack indices, and the recession model forecasts continued to deteriorate in April. The diffusion index jumped from 11 (42.3%) to 16 (61.5%) in April. The new 0.5-sigma diffusion index climbed from 73.8% to 80.8%. The mean and median recession slack indices both plummeted this month (to -1.94 and -0.23 respectively). The moving average of explanatory variables with increasing slack dropped sharply from 44.9% to 26.9% in April. The aggregate recession probability vaulted from 62.0% to 94.4%. The peak-trough recession probability remained extremely high: 96.3%.
Based on the most recent data, the equity allocation percentage regression model indicates that the expected annual price return of the S&P 500 index for the next 10 years dropped from +2.0% last month back into negative territory (-0.1%), with an expected drawdown in that period of 35% (from 5/1/2020 levels). The decline in expected future returns is due to the sharp rebound in equity prices since March 23rd. Expected future equity returns are still quite low in a historical context, especially given the near-term market, economic, and geopolitical risks.
The "Buffett Indicator" regression model currently indicates that the expected annual price return of the S&P 500 index for the next 10 years is still alarmingly negative (-7.5%), with an expected drawdown in that 10-year period of 62% (from 5/1/2020 levels).
Given the unprecedented and ongoing effects of shutting down the U.S. and global economies, I used a forward estimate of negative 34% annualized GDP "growth" in Q2 when calculating the most recent Buffet Indicator ratio. Similar forward-looking adjustments would be required when calculating P/E or other valuation ratios. The resulting Buffett ratio incorporates forward-looking near-term GDP estimates as well as market data as of 5/1/2020. The most recent Buffett Indicator value was higher than 99% of the historical Buffett Indicator ratios since 1951. History offers compelling evidence that bullish equity positions today will face reduced returns over the coming years.
Unlike human prognosticators, the Trader Edge recession models are completely objective and have no ego. They are not burdened by the emotional need to defend past erroneous forecasts and will always consistently apply the insights gained from new data.
Brian Johnson
Copyright 2020 Trading Insights, LLC. All rights reserved.
Option Strategy Risk Management: An In-Depth Article Introducing an Interactive Analytical Framework for Hedging Option Strategy Risk
Option Income Strategy Trade Filters: An In-Depth Article Demonstrating the Use of Trade Filters to Enhance Returns and Reduce Risk
Exploiting Earnings Volatility: An Innovative New Approach to Evaluating, Optimizing, and Trading Option Strategies to Profit from Earnings Announcements.
Option Strategy Risk / Return Ratios: A Revolutionary New Approach to Optimizing, Adjusting, and Trading Any Option Income Strategy


Recession Model Forecast: 05-01-2020
I made a number of significant improvements to the recession model in January of 2020. If you missed the January recession model post, or if you would like to review the improvements to the models, please revisit the Recession Model Forecast: 01-01-2020. Last month, I reduced the number of input variables in all of the peak-trough neural network models and expanded the number of individual models. I continued to work with the neutral network models this month, further constraining the models, which made them even more robust - especially when interpreted as a single aggregate peak-trough forecast. No changes were made to any of the explanatory variables.
I also recently developed a SEIR model for COVID-19, with variables for the magnitude and timing of social distancing restrictions, as well a probabilistic variable for decaying immunity. The results were ominous and are not fully reflected in equity prices, especially after the very large rebound from the March 23rd lows in April and May month-to-date. The growth rate in new Coronavirus cases is only slightly less than my model estimates during the social distancing phase. I documented the model results in an in-depth article titled: "New Coronavirus Model and the Economy," which I posted on April 1, 2020.
Monthly Update
This article updates the diffusion indices, recession slack index, aggregate recession model, and aggregate peak-trough model through April 2020. Most of the explanatory variables are now capturing the effects of COVID-19 on the market and on the U.S. economy - however, there are still a few data series that have more pronounced delays.
The current 26-variable model has a diverse set of explanatory variables and is quite robust. Each of the explanatory variables has predictive power individually; when combined, the group of indicators is able to identify early recession warnings from a wide range of diverse market-based, fundamental, technical, and economic sources.
Several of the explanatory variables are market-based. These variables are available in real-time (no lag), which means they respond very quickly to changing market conditions. In addition, they are never revised. This makes the Trader Edge recession model more responsive than many recession models. The current and historical data in this report reflect the current model configuration with all 26 variables.
Diffusion Index
The Trader Edge diffusion index equals the percentage of independent variables indicating a recession. With the latest changes, there are now a total of 26 explanatory variables, each with a unique look-back period and recession threshold. The resulting diffusion index and the trend in the diffusion index are two of the variables used to estimate the probit, logit, and neural network model forecasts.
The graph of the diffusion index from 1/1/2006 to 5/1/2020 is presented in Figure 1 below (in red - left axis). The gray shaded regions in Figure 1 below represent U.S. recessions as defined (after the fact) by the National Bureau of Economic Research (NBER). Due to the typical NBER delay, I have preliminarily shaded the likely beginning of a new U.S. recession in March 2020. The value of the S&P 500 index is also included (in blue - right axis).
The U.S. economy flirted with entering a recession in early 2016, which was reflected in the deteriorating economic, fundamental, and especially market-based data. The diffusion index, slack index, and recession probability forecasts all captured the weakening conditions. However, the weakness proved to be temporary and the conditions and recession model forecasts improved rapidly.
Preliminary signs of weakness in the diffusion index reemerged in late 2018 and conditions deteriorated rapidly in December and January before rebounding in February through April of 2019 and stabilizing thereafter. However, the slack indices remained depressed throughout 2019.
Upon detailed examination of the individual economic data series, it is clear that the Government shutdown temporarily affected the economic data in early 2019. The most recent economic data is no longer affected, but the shutdown did temporarily affect the look-back data and the resulting trends. I initially went back and smoothed the trend data for every economic variable, but the new trend calculation is even more effective at reducing the impact of outliers, which makes it more robust. Smoothing the look-back data mitigates the impact of all such data outliers now and in the future.
The number of explanatory variables indicating a recession jumped from 11 (42.3%) to 16 (61.5%) in April, which is the highest diffusion index value since the great recession - by far.
As explained above, it will take another month or so before the effects of the coronavirus are fully reflected in all of the explanatory variables, but most of these variables are already capturing these effects.
Please note that past estimates and index values will change whenever the historical data is revised and/or whenever model improvements are implemented. All current and past forecasts and index calculations are based on the most recent models using the latest revised data from the current data set.
Figure 1: Diffusion Index 05-01-2020
0.5-Sigma Diffusion Index
The Trader Edge 0.5-sigma diffusion Index equals the percentage of explanatory variables with Z-scores that are less than 0.5 standard deviations above their respective recession thresholds. This new diffusion index is much more sensitive than the standard (zero-sigma) diffusion index. As a result, it provides much more detail on the health of the U.S. economy. The new 0.5-sigma diffusion index and the trend in the new diffusion index are two of the variables used to estimate the probit, logit, and neural network model forecasts.
The graph of the 0.5-sigma diffusion index from 1/1/2006 to 5/1/2020 is presented in Figure 2 below (in red - left axis). The gray shaded regions in Figure 2 below represent U.S. recessions as defined (after the fact) by the National Bureau of Economic Research (NBER). The value of the S&P 500 index is also included (in blue - right axis). As explained above, I have preliminarily shaded the likely beginning of a new U.S. recession in March 2020.
The percentage of explanatory variables with Z-scores below the 0.5-sigma early warning threshold spiked from 73.1% to 80.8% in April, almost exclusively due to the economic effects of Coronavirus. The additional level of detail provided by this more continuous and responsive metric will be invaluable going forward, especially given the infrequent and more discrete movements of the standard (zero-sigma) diffusion index.
As I noted in past months, the percentage of variables with Z-scores below their respective 0.5 sigma thresholds had been unusually high, especially with the standard diffusion index equal to zero. This significantly reduced the potential cushion to any adverse economic shocks and accelerated the decline due to the Coronavirus.
This new 0.5-sigma diffusion index and the trend in the new diffusion index are now both used directly in the neural network recession models. When combined with the recession slack indices, the new diffusion index provides even greater insight into rapidly changing conditions.
Figure 2: 0.5 Sigma Diffusion Index 05-01-2020
Recession Slack Indices
The Trader Edge recession slack index equals the median standardized deviation of the current value of the explanatory variables from their respective recession thresholds. The resulting value signifies the amount of slack or cushion relative to the recession threshold, expressed in terms of the number of standard deviations. Higher slack values signify larger cushions above recessionary threshold levels. While the median recession slack index is used in the recession models, I am now including the mean recession slack index in the graph as well. I use both of these values in the neural network models and in the probit and logit models.
The gray shaded regions in Figure 3 below represent U.S. recessions as defined (after the fact) by the NBER. The median recession slack index is depicted in purple and is plotted against the right axis, which is expressed as the number of standard deviations above the recession threshold. The mean recession slack index is depicted in blue and is also plotted against the right axis.
The dark-red, horizontal line at 0.50 standard deviations denotes a possible warning threshold for the recession slack index. Many of the past recessions began when the recession slack index crossed below 0.50. Similarly, many of the past recessions ended when the recession slack index crossed back above 0.0.
In April 2020, the median recession slack index plunged from 0.10 to -0.23. The mean recession slack index (affected more by outliers) plummeted from -0.18 to -1.94. Similar to the situation with the 0.5-sigma diffusion index, the mean and median slack indices had been unusually low. This made the U.S. economy particularly vulnerable to any adverse economic shocks, which accelerated the decline due to the Coronavirus. Note, all of these values reflect the new smoothed trend data.
Figure 3: Recession Slack Index 05-01-2020
To gain further insight into the slack index, I provide the three-month moving average of the percentage of variables with increasing slack in Figure 4, but I personally monitor the monthly percentages as well.
Slack is a standardized value, so it is directly comparable across all variables. More slack indicates a larger cushion relative to a recessionary environment. As a result, we would like to see as many variables as possible with increasing slack. Given the diverse nature of the explanatory variables, it is unusual to see more than 60% of the variables with increasing slack or fewer than 40% of the variables with increasing slack. These extreme values are significant and predictive of the near-term direction of economic growth and often the equity market.
The 3-month moving average of the percentage of variables with increasing slack decreased sharply from 44.9% to 26.9% in April. The percentage of variables with increasing slack was only 11.5% in April - the lowest monthly value since November 2008. New evidence of economic weakness (or strength) often shows up first in this timely metric.
Figure 4: MA(3) % Slack Increasing 05-01-2020
The ability to track small variations and trend changes over time illustrates the advantage of monitoring the continuous recession slack index. The new slack variable provides additional insight into the near-term direction of the economy and should be used in conjunction with the median recession slack index.
While it is useful to track the actual recession slack index values and percentage of variables with increasing slack, the diffusion percentages and slack index values are also used to generate the more intuitive probit and logit probability forecasts.
Aggregate Recession Probability Estimate
The Trader Edge aggregate recession model averages the estimates from probit and logit models derived from the level and trend in a subset of the four variables described above: the original diffusion index, the 0.5-sigma diffusion index, the slack indices, and the percentage of variables with increasing slack. The aggregate recession model estimates from 1/1/2006 to 5/01/2020 are depicted in Figure 5 below (red line - left vertical axis). The gray shaded regions represent NBER recessions and the blue line reflects the value of the S&P 500 index (right vertical axis). As explained above, I have preliminarily shaded the likely beginning of a new U.S. recession in March 2020. I suggest using a warning threshold of between 20-30% for the aggregate recession model (green horizontal line).
The aggregate recession model probability estimate jumped from 62.0% to 94.4% in April. It is now a virtual certainty that the U.S. is currently in a recession.
Figure 5: Aggregate Recession Model 05-01-2020
Aggregate Peak-Trough Probability Estimate
The peak-trough model forecasts are different from the recession model and are much more responsive. The peak-trough models estimate the probability of the S&P 500 being between the peak and trough associated with an NBER recession. The S&P 500 typically peaks before recessions begin and bottoms out before recessions end. As a result, it is far more difficult for the peak-trough model to fit this data and the model forecasts have larger errors than the recession model.
The Trader Edge aggregate peak-trough model is a weighted-average of the estimates from a number different neural network models, all of which use the levels and trends of the diffusion and slack indices described above.
The aggregate peak-trough model estimates from 1/1/2006 to 5/01/2020 are depicted in Figure 6 below, which uses the same format as Figure 5, except that the shaded regions represent the periods between the peaks and troughs associated with NBER recessions. Due the unavoidable NBER delay, I have preliminarily shaded the likely peak associated with the beginning of a new U.S. recession in February 2020. The value of the S&P 500 index is also included (in blue - right axis).
The aggregate peak-trough model probability estimate for 5/01/2020 was 96.3%, which is almost unchanged from last months revised value of 96.6%. It is highly likely that the S&P 500 index is now between the peak and trough associated with a new U.S. recession.
The probability forecasts are continuous, but when the probabilities are elevated, modest changes from month to month (even 10-15%) are not unusual. As a result, it can also be useful to use a discrete cutoff value (such as 50%) to make a discrete (0/1) recession or peak-trough determination.
Figure 6: Aggregate Peak-Trough Model 05-01-2020
Conclusion
The diffusion indices, slack indices, and the recession model forecasts continued to deteriorate in April. The diffusion index jumped from 11 (42.3%) to 16 (61.5%) in April. The new 0.5-sigma diffusion index climbed from 73.8% to 80.8%. The mean and median recession slack indices both plummeted this month (to -1.94 and -0.23 respectively). The moving average of explanatory variables with increasing slack dropped sharply from 44.9% to 26.9% in April. The aggregate recession probability vaulted from 62.0% to 94.4%. The peak-trough recession probability remained extremely high: 96.3%.
Based on the most recent data, the equity allocation percentage regression model indicates that the expected annual price return of the S&P 500 index for the next 10 years dropped from +2.0% last month back into negative territory (-0.1%), with an expected drawdown in that period of 35% (from 5/1/2020 levels). The decline in expected future returns is due to the sharp rebound in equity prices since March 23rd. Expected future equity returns are still quite low in a historical context, especially given the near-term market, economic, and geopolitical risks.
The "Buffett Indicator" regression model currently indicates that the expected annual price return of the S&P 500 index for the next 10 years is still alarmingly negative (-7.5%), with an expected drawdown in that 10-year period of 62% (from 5/1/2020 levels).
Given the unprecedented and ongoing effects of shutting down the U.S. and global economies, I used a forward estimate of negative 34% annualized GDP "growth" in Q2 when calculating the most recent Buffet Indicator ratio. Similar forward-looking adjustments would be required when calculating P/E or other valuation ratios. The resulting Buffett ratio incorporates forward-looking near-term GDP estimates as well as market data as of 5/1/2020. The most recent Buffett Indicator value was higher than 99% of the historical Buffett Indicator ratios since 1951. History offers compelling evidence that bullish equity positions today will face reduced returns over the coming years.
Unlike human prognosticators, the Trader Edge recession models are completely objective and have no ego. They are not burdened by the emotional need to defend past erroneous forecasts and will always consistently apply the insights gained from new data.
Brian Johnson
Copyright 2020 Trading Insights, LLC. All rights reserved.
Option Strategy Risk Management: An In-Depth Article Introducing an Interactive Analytical Framework for Hedging Option Strategy Risk
Option Income Strategy Trade Filters: An In-Depth Article Demonstrating the Use of Trade Filters to Enhance Returns and Reduce Risk
Exploiting Earnings Volatility: An Innovative New Approach to Evaluating, Optimizing, and Trading Option Strategies to Profit from Earnings Announcements.
Option Strategy Risk / Return Ratios: A Revolutionary New Approach to Optimizing, Adjusting, and Trading Any Option Income Strategy
About Brian Johnson
I have been an investment professional for over 30 years. I worked as a fixed income portfolio manager, personally managing over $13 billion in assets for institutional clients. I was also the President of a financial consulting and software development firm, developing artificial intelligence based forecasting and risk management systems for institutional investment managers. I am now a full-time proprietary trader in options, futures, stocks, and ETFs using both algorithmic and discretionary trading strategies. In addition to my professional investment experience, I designed and taught courses in financial derivatives for both MBA and undergraduate business programs on a part-time basis for a number of years. I have also written four books on options and derivative strategies.